Skip to main content
Microeconomics
My Course
Learn
Exam Prep
AI Tutor
Study Guides
Flashcards
Explore
Try the app
My Course
Learn
Exam Prep
AI Tutor
Study Guides
Flashcards
Explore
Try the app
Back
Isocost Lines quiz
You can tap to flip the card.
What does an isocost line represent in microeconomics?
You can tap to flip the card.
👆
What does an isocost line represent in microeconomics?
An isocost line shows all combinations of two inputs that result in the same total cost for a firm.
Track progress
Control buttons has been changed to "navigation" mode.
1/15
Related flashcards
Related practice
Recommended videos
Isocost Lines definitions
Isocost Lines
15 Terms
Isocost Lines
10. The Costs of Production
8 problems
Topic
Cost-Minimizing Combination of Labor and Capital
10. The Costs of Production
9 problems
Topic
10. The Costs of Production
9 topics
15 problems
Chapter
Guided course
04:27
Isocost Lines
2001
views
13
rank
Terms in this set (15)
Hide definitions
What does an isocost line represent in microeconomics?
An isocost line shows all combinations of two inputs that result in the same total cost for a firm.
How does a firm determine the maximum quantity of an input it can afford?
The firm divides its total budget by the price of the input to find the maximum quantity it can afford.
If Spooky Cookies spends its entire \$24,000 budget on ovens costing \$6,000 each, how many ovens can it buy?
It can buy 4 ovens, since \$24,000 divided by \$6,000 equals 4.
If Spooky Cookies spends its entire \$24,000 budget on bakers costing \$3,000 each, how many bakers can it hire?
It can hire 8 bakers, since \$24,000 divided by \$3,000 equals 8.
On a typical isocost graph, which input is usually placed on the x-axis?
Labor is generally placed on the x-axis.
What is the formula for finding the maximum amount of an input a firm can afford?
The formula is: Maximum quantity = Budget ÷ Price of the input.
Why is the isocost line straight?
The isocost line is straight because input prices are constant, so the trade-off between inputs does not change.
What does any point on the isocost line indicate?
Any point on the isocost line indicates a combination of inputs that uses the entire budget.
How can a firm use isocost and isoquant lines together?
A firm can compare isocost and isoquant lines to find the lowest-cost combination of inputs that achieves a desired production level.
If Spooky Cookies chooses 4 bakers and 2 ovens, is this combination affordable with their \$24,000 budget?
Yes, because this combination lies on the isocost line for their budget.
What does the slope of the isocost line represent?
The slope represents the rate at which one input can be substituted for another while keeping total cost constant.
How do you plot an isocost line on a graph?
Plot the maximum quantities of each input on their respective axes and connect these points with a straight line.
What happens to the isocost line if the budget increases?
The isocost line shifts outward, allowing for more of both inputs to be purchased.
What happens to the isocost line if the price of one input increases?
The intercept for that input decreases, making the isocost line steeper or flatter depending on which input's price changed.
Why is the isocost line useful for firms?
It helps firms identify all affordable combinations of inputs and choose the most cost-effective mix for production.
 BackBack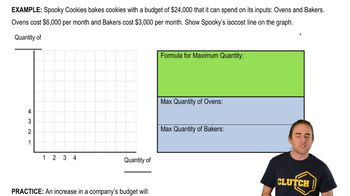
 04:27
04:27