 Back
BackFluid and Electrolyte Balance: Water, Sodium, Potassium, Chloride, and Phosphorus
Study Guide - Smart Notes
 Tailored notes based on your materials, expanded with key definitions, examples, and context.
Fluid and Electrolyte Balance
Introduction to Body Water
Water is the most abundant component of the human body, essential for maintaining physiological balance and supporting metabolic processes. The distribution of water varies among different tissues and is influenced by factors such as age, sex, and body composition.
Blood: ~90% water
Muscle: ~75% water
Bone: ~25% water
Adipose tissue: ~10% water
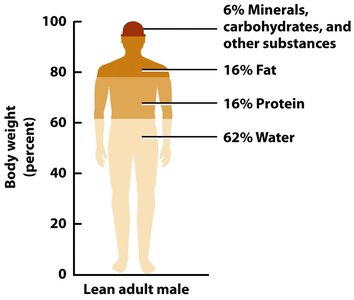
Lean tissue contains more water than fat tissue, so individuals with higher muscle mass have a greater percentage of body water. Water acts as a solvent (dissolving medium) for solutes (dissolved substances), forming solutions essential for cellular function.
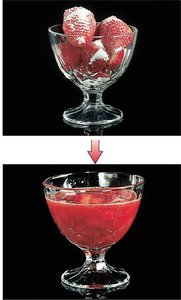
Water as a Solvent
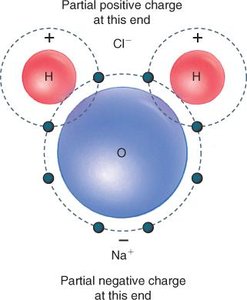
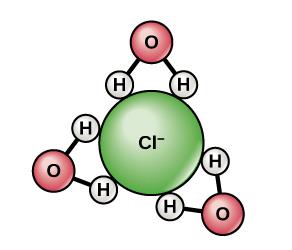
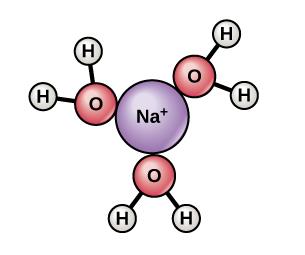
Water's polarity allows it to dissolve a wide range of substances, making it an excellent solvent for biological reactions. This property is crucial for nutrient transport, waste removal, and chemical reactions in the body.
Solvent: The substance (water) that dissolves other substances.
Solute: The dissolved substances (e.g., electrolytes, nutrients).
Solution: A homogeneous mixture of solvent and solute.
Functions of Water in the Body
Water serves multiple critical functions in the human body:
Transport: Carries nutrients and waste products via blood and urine.
Lubrication and Protection: Forms synovial fluid (joints), tears (eyes), and saliva (mouth).
Temperature Regulation: High heat capacity prevents drastic temperature changes.
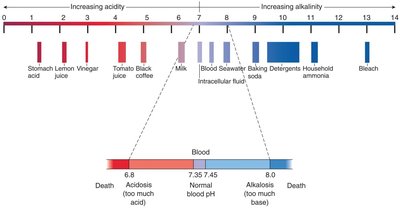
Water and pH Balance
Water helps maintain acid-base balance in the body, which is vital for normal cellular function. The pH scale measures the concentration of hydrogen ions, with blood pH tightly regulated between 7.35 and 7.45.
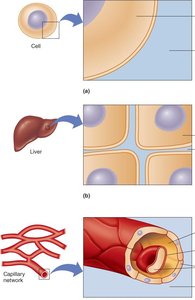
Distribution of Body Fluids
Intracellular and Extracellular Fluid
Body water is distributed between two main compartments:
Intracellular fluid (ICF): Fluid within cells; highest concentration of potassium.
Extracellular fluid (ECF): Fluid outside cells, including:
Tissue fluid (e.g., cerebrospinal, synovial, mucus)
Intravascular fluid (plasma, lymph)
Highest concentration of sodium and chloride
Water moves between these compartments by osmosis, driven by solute concentrations and fluid pressure.
Water Balance in the Body
Sources and Losses of Water
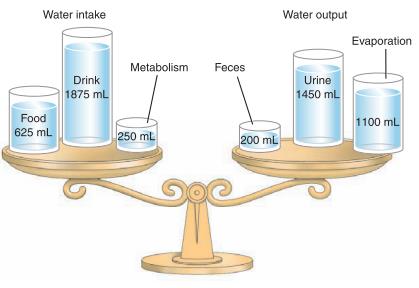
Water is not stored in the body; thus, intake must balance output to maintain homeostasis.
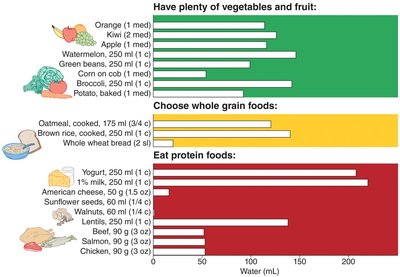
Water Input:
Food: ~20-25%
Beverages: ~75-80% (some contain diuretics)
Metabolic water: ~10% (produced during cellular respiration)
Water Output:
Urine: 1-2 L/day
Feces: <1 cup/day
Insensible losses: ~1 L/day (skin and lungs)
Sweat: variable, increases with activity and temperature
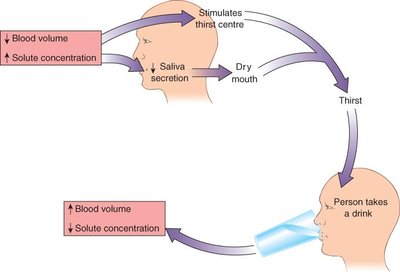
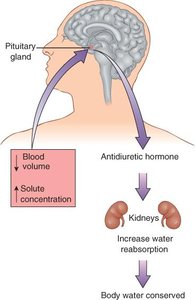
Regulation of Water Balance
The kidneys and thirst mechanisms regulate water balance. The kidneys filter blood, reabsorbing needed substances and excreting excess water and solutes as urine. Thirst is triggered by decreased blood volume or increased solute concentration, stimulating the hypothalamus to promote fluid intake.
Dehydration and Overhydration
Dehydration occurs when fluid loss exceeds intake, leading to reduced blood volume, impaired oxygen and nutrient delivery, and potentially heat exhaustion or heat stroke. Overhydration (water intoxication) can dilute blood sodium, causing hyponatremia and tissue swelling (edema).
Symptoms of dehydration: Cramps, nausea, dizziness, fainting, rapid pulse
Symptoms of overhydration: Confusion, convulsions, coma
Meeting Water Needs
The Adequate Intake (AI) for water is 3.7 L/day for males and 2.7 L/day for females. Needs increase with physical activity, high temperature, low humidity, high-protein or high-salt diets, and intake of caffeine or alcohol.
Electrolytes: Sodium, Potassium, and Chloride
Introduction to Electrolytes
Electrolytes are minerals that carry an electrical charge in solution. The main electrolytes in body fluids are sodium (Na+), potassium (K+), and chloride (Cl-). Their distribution affects water movement and is essential for nerve conduction, muscle contraction, and fluid balance.
Sodium: Major extracellular cation
Potassium: Major intracellular cation
Chloride: Major extracellular anion
Functions of Electrolytes
Regulate fluid balance between compartments
Enable nerve impulse transmission
Facilitate muscle contraction
Maintain acid-base balance
Electrolyte imbalances can cause muscle cramps, confusion, irregular heartbeat, and in severe cases, cardiac arrest.
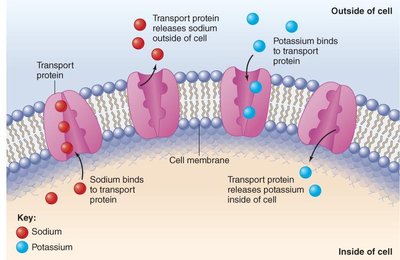
Electrolyte Balance and Transport
Electrolyte concentrations are maintained by fluid pressure, osmosis, and active transport mechanisms. Transport proteins in cell membranes move sodium and potassium in and out of cells, maintaining proper gradients for cellular function.
Regulation of Electrolyte Balance
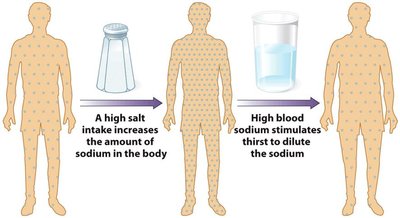
Electrolyte levels are regulated by the kidneys and hormonal signals. High salt intake stimulates thirst and water intake, while low salt intake increases the desire for salty foods. Vomiting, diarrhea, and excessive sweating can disrupt electrolyte balance, leading to conditions such as hyponatremia (low sodium).
Sodium: Sources, Recommendations, and Health Effects
Dietary Sources of Sodium
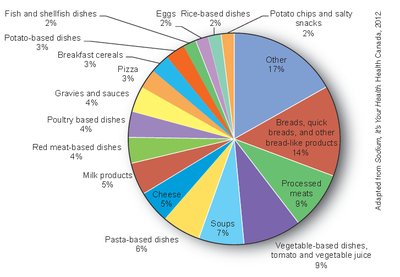
The majority of dietary sodium comes from processed foods, with smaller amounts from naturally occurring sources and added salt.
Processed foods: 77%
Naturally occurring: 12%
Added at the table: 11%
Sodium Recommendations and Label Literacy
The Tolerable Upper Intake Level (UL) for sodium is 2,300 mg/day. Adults with prehypertension or hypertension should limit intake to 1,500 mg/day. Food labels provide information on sodium content, with terms such as "sodium-free," "low sodium," and "reduced sodium" indicating different levels of sodium reduction.
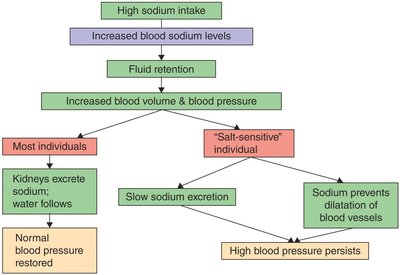
Sodium and Hypertension
High sodium intake is associated with increased risk of hypertension (high blood pressure), a major public health concern. Reducing sodium intake can significantly lower the risk of hypertension and cardiovascular disease.
Normal blood pressure: <120/80 mm Hg
Hypertension: ≥140/90 mm Hg
Salt sensitivity varies among individuals; some are more affected by sodium intake than others.
Potassium: Sources, Recommendations, and Health Effects
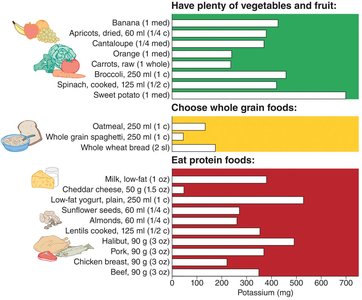
Dietary Sources of Potassium
Potassium is abundant in fresh fruits, vegetables, legumes, whole grains, milk, and meat. Processed foods are typically low in potassium.
Best sources: Bananas, potatoes, spinach, oranges, lentils
Potassium Recommendations and Health Effects
AI for adults (19-50 years): 4,700 mg/day
Typical intake: 2,600 mg/day (below recommendations)
Deficiency (hypokalemia): Irregular heartbeat, fatigue, muscle cramps
Excess (hyperkalemia): Abnormal heartbeat, potentially fatal
Increasing potassium intake by consuming more fresh foods and fewer processed foods supports cardiovascular health and helps maintain normal blood pressure.
Summary Table: Water and Electrolytes
Nutrient | Sources | Recommended Intake for Adults | Major Functions | Deficiency Diseases and Symptoms | Groups at Risk of Deficiency | Toxicity | UL or CDRR |
|---|---|---|---|---|---|---|---|
Water | Drinking water, other beverages, food | 2.7–3.7 L/d | Solvent, reactant, protector, transporter, regulator of temperature and pH | Thirst, weakness, poor endurance, confusion, disorientation | Infants, those with fever and diarrhea, elderly, athletes | Confusion, coma, convulsions | ND |
Sodium | Table salt, processed foods | 1,500 mg/d | Major positive extracellular ion, nerve transmission, muscle contraction, fluid balance | Muscle cramps | Those on sodium-restricted diets, excessive sweating | Contributes to high blood pressure | 2,300 mg/d |
Potassium | Fresh fruits, vegetables, legumes, whole grains, milk, meat | 3,400 mg/d (males), 2,600 mg/d (females) | Major positive intracellular ion, nerve transmission, muscle contraction, fluid balance | Irregular heartbeat, fatigue, muscle cramps | Poor diets high in processed foods, those on diuretics | Abnormal heartbeat | ND |
Chloride | Table salt, processed foods | 2,300 mg/d | Major negative extracellular ion, fluid balance | Unlikely | None | None likely | 3,600 mg/d |
Additional info: ND = Not determined; UL = Tolerable Upper Intake Level; CDRR = Chronic Disease Risk Reduction intake.
