 Back
BackHealthy Body Weight: Assessment, Interpretation, and Implications
Study Guide - Smart Notes
 Tailored notes based on your materials, expanded with key definitions, examples, and context.
Healthy Body Weight
Defining a Healthful Body Weight
A healthful body weight is not a single number but a range that supports optimal health and well-being. It is influenced by genetics, age, sex, and lifestyle factors, and should be achievable and sustainable without extreme dieting or unhealthy behaviors.
Appropriate for age and physical development: Body weight should reflect the individual's stage of growth and development.
Metabolic health: Compatible with normal blood pressure, lipid levels, and glucose tolerance.
Genetic and family background: Takes into account inherited body shape and weight tendencies.
Supported by healthy habits: Encourages regular physical activity and balanced eating patterns.
Personal acceptance: The weight should be acceptable to the individual, supporting mental and emotional well-being.
Best Weight: According to the 2020 Canadian Adult Obesity Clinical Practice Guidelines, the best weight is "the weight that a person can achieve and maintain while living their healthiest and happiest life." It is not based on a specific number but on individual circumstances.
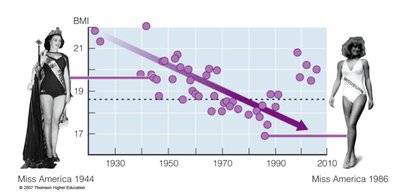
Trends in Body Weight Perception
Societal standards of ideal body weight have shifted over time, often influenced by media and cultural trends. For example, the average BMI of Miss America winners has decreased over the decades, reflecting changing beauty standards rather than health recommendations.
Evaluating Body Weight
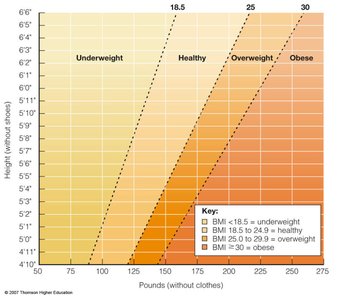
Body Mass Index (BMI)
BMI is a widely used screening tool that relates weight to height. It helps identify individuals at risk for health problems but does not directly measure body fat or health status.
Formula (metric):
Formula (imperial):
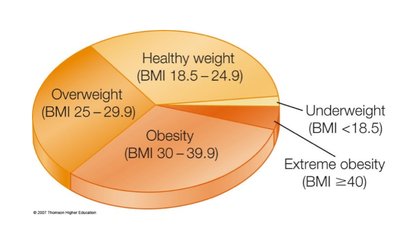
Categories: Underweight (<18.5), Healthy weight (18.5–24.9), Overweight (25–29.9), Obesity (30–39.9), Extreme obesity (≥40)
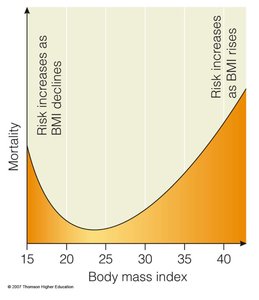
Health Risks Associated with Body Weight
Both underweight and overweight/obesity are associated with increased health risks, including metabolic, cardiovascular, and reproductive complications.
Underweight: Increased risk of osteoporosis, infertility, and poor stress tolerance.
Overweight/Obesity: Higher risk of type 2 diabetes, hypertension, cardiovascular disease, and depression.
Controversies and Limitations of BMI
BMI is a useful population-level tool but has significant limitations for individuals. It does not distinguish between muscle and fat, nor does it account for fat distribution or ethnic differences in health risk.
Obesity Paradox: Some studies show that overweight or mildly obese individuals may have better health outcomes in certain populations.
Limitations: Not accurate for athletes, older adults, children, or pregnant women; does not reflect body composition or fat location.
Example: Athletes with high muscle mass may have a BMI in the overweight or obese range but are metabolically healthy.


Body Composition
Measuring Body Composition
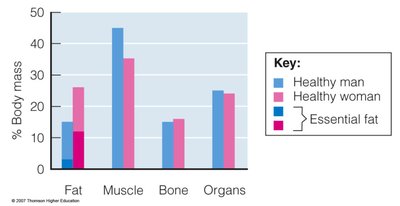
Body composition refers to the proportions of fat, muscle, bone, and other tissues in the body. Assessing body composition provides a more accurate picture of health than BMI alone.
Essential fat: Required for normal physiological function.
Storage fat: Energy reserve, insulation, and protection.
Measurement methods: Skinfold thickness, bioelectrical impedance, near-infrared interactance, underwater weighing, and DEXA scan.
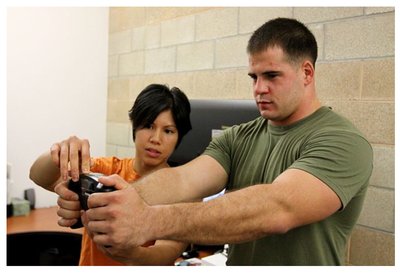
Bioelectrical Impedance
This method estimates body fat by measuring the resistance of body tissues to a small electrical current. Lean tissue, which contains more water, conducts electricity better than fat tissue.
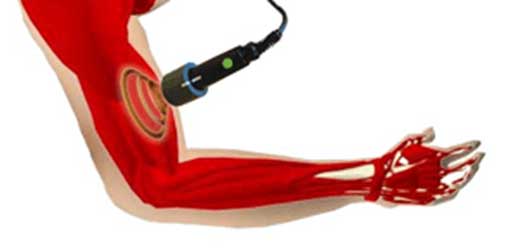
Near Infrared Interactance (NIR)
NIR uses a fiber optic probe to measure the absorption and reflection of light in tissues, which correlates with body fat content.
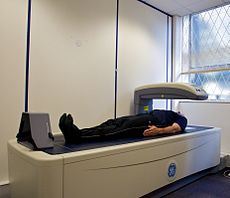
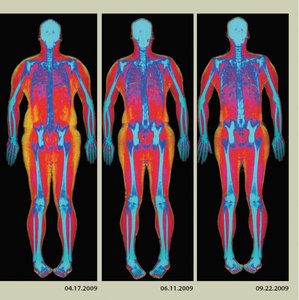
Dual Energy X-ray Absorptiometry (DEXA)
DEXA uses low-dose X-rays to differentiate between bone, lean tissue, and fat mass, providing a detailed assessment of body composition.
Body Fat Distribution
Patterns of Fat Distribution
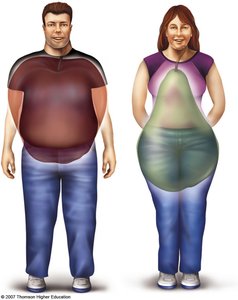
Where fat is stored in the body affects health risk. Upper body (android or "apple-shaped") fat is more strongly associated with chronic diseases than lower body (gynoid or "pear-shaped") fat.
Upper body fat (apple-shaped): More common in men; higher risk of heart disease, stroke, diabetes, and hypertension.
Lower body fat (pear-shaped): More common in women; not usually associated with increased chronic disease risk.
Waist-to-hip ratio: Higher risk if >0.90 for men or >0.85 for women.
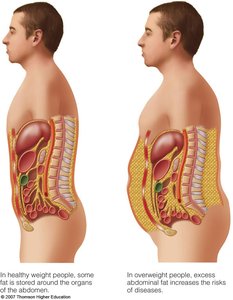
Visceral Fat and Metabolic Syndrome
Visceral fat, stored around the abdominal organs, is more metabolically active and associated with increased risk of cardiovascular disease, diabetes, and other conditions. Metabolic syndrome is diagnosed when three or more risk factors (abdominal obesity, high triglycerides, low HDL, high blood pressure, high fasting glucose) are present.
BMI and Metabolic Health
Not all individuals with a high BMI are metabolically unhealthy, and not all with a normal BMI are healthy. Metabolic health is determined by factors such as blood pressure, lipid levels, and glucose tolerance, not just body size.
BMI Category | % Metabolically Healthy |
|---|---|
Normal Weight | 69% |
Overweight | 47% |
Obese | 29% |
Key Point: Body size alone is not an accurate indicator of health. A holistic assessment is necessary.
