 Back
BackScientific Tools for Nutrition Research: Graphs, Statistics, and Risk Analysis
Study Guide - Smart Notes
 Tailored notes based on your materials, expanded with key definitions, examples, and context.
Scientific Tools in Nutrition Research
Graph Reading and Components
Understanding graphs is essential for interpreting data in nutrition science. Graphs visually represent relationships between variables, allowing researchers to analyze trends, patterns, and differences.
x-axis: Typically represents the independent variable, which is chosen by the researcher.
y-axis: Represents the dependent variable, which is measured in the experiment.
Independent Variable: The factor manipulated or categorized by the researcher (e.g., time, type of food).
Dependent Variable: The outcome measured (e.g., nutrient concentration, body weight).
Error Bars: Indicate uncertainty or variation in the data, showing how data is distributed around the mean.
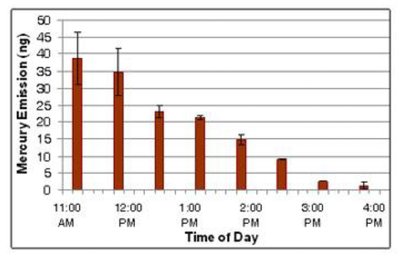
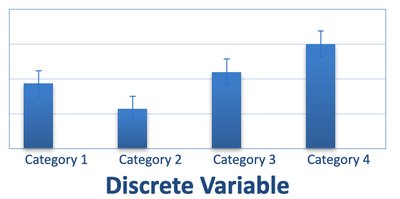
Types of Graphs: Bar vs. Line
The choice between bar and line graphs depends on the nature of the data:
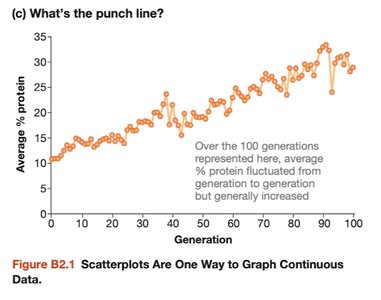
Line Graphs: Used for continuous data (e.g., weight, calories), where the x-axis represents a scale.
Bar Graphs: Used for discrete data (e.g., categories of food or nutrients), where the x-axis represents distinct groups.
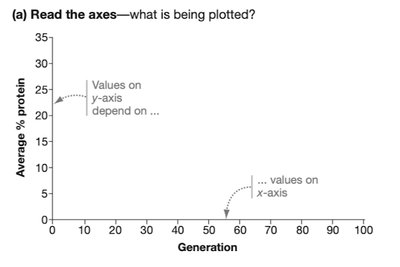
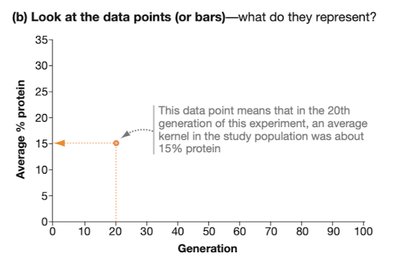
Reading Graphs: Steps and Interpretation
To accurately interpret graphs, follow these steps:
Read the axes: Identify what is being plotted on each axis.
Examine data points or bars: Understand what each point or bar represents.
Analyze trends: Look for patterns, increases, decreases, or fluctuations.
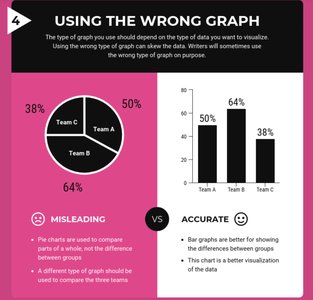
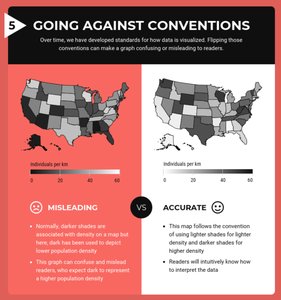
Graph Tricks and Misleading Graphs
Graphs can be manipulated to mislead viewers. Common tricks include:
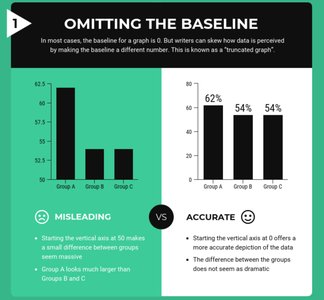
Omitting the baseline: Starting the y-axis at a value other than zero exaggerates differences.
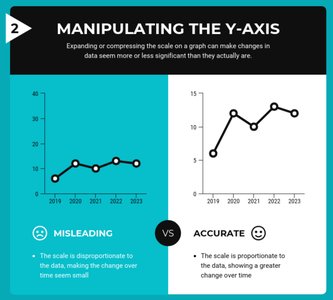
Manipulating the y-axis: Changing the scale can make changes appear more or less significant.
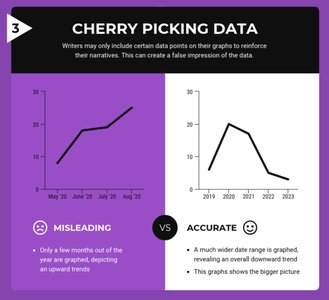
Cherry picking data: Selecting only certain data points to reinforce a narrative.
Using the wrong graph: Choosing an inappropriate graph type can distort interpretation.
Going against conventions: Flipping standard visual conventions can confuse readers.
Statistics in Nutrition Research
Statistical Significance and p-value
Statistical analysis helps determine whether observed effects are likely due to chance or represent true relationships.
Statistical Significance: Indicates sufficient evidence that a relationship or treatment effect exists.
p-value: The probability of obtaining the observed results if there is no real effect. A p-value less than 0.05 () is generally considered significant.
Variation, Precision, and Accuracy
Variation describes how much individual data points differ from the average. Precision and accuracy are important concepts:
Precision: How close repeated measurements are to each other.
Accuracy: How close measurements are to the true value.
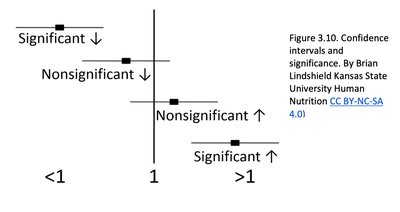
Confidence Intervals
A confidence interval (CI) provides a range within which the true value is likely to fall. A 95% CI means there is a 95% chance the interval contains the true value. Narrower intervals indicate greater precision.
Formula for Confidence Interval:
Risk Analysis in Nutrition Studies
Relative Risk, Odds Ratio, and Hazard Ratio
Risk analysis compares the likelihood of outcomes between groups. These measures are crucial for understanding the impact of dietary factors on health.
Relative Risk (RR): Compares risk in the treatment group to the control group.
RR = 1.0: No difference between groups
RR > 1: Increased risk in the treatment group
RR < 1: Decreased risk in the treatment group
Odds Ratio: Compares the odds of an outcome between groups.
Hazard Ratio: Compares the rate of occurrence of an event over time between groups.
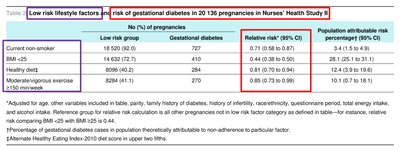
Application: Risk of Gestational Diabetes
Relative risk is often used in nutrition studies to assess the impact of lifestyle factors on health outcomes, such as gestational diabetes.
Factor | Relative Risk (95% CI) |
|---|---|
Current non-smoker | 0.81 (0.70 to 0.95) |
BMI < 25 | 0.44 (0.37 to 0.53) |
Healthy diet | 0.75 (0.63 to 0.89) |
Moderate/vigorous exercise | 0.70 (0.58 to 0.84) |
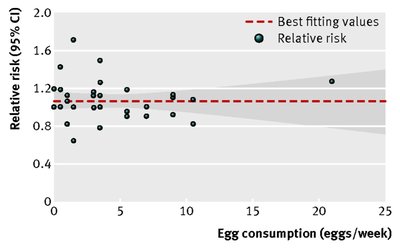
Meta-Analysis and Dose-Response
Meta-analyses combine data from multiple studies to assess overall trends, such as the relationship between egg consumption and risk of coronary heart disease (CHD).
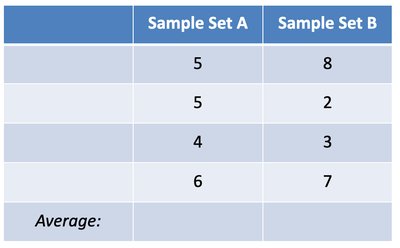
Summary Table: Sample Data and Averages
Calculating averages is a fundamental statistical tool in nutrition research.
Sample Set A | Sample Set B |
|---|---|
5 | 8 |
5 | 2 |
4 | 3 |
6 | 7 |
Average: | Average: |
Conclusion
Mastery of scientific tools such as graph interpretation, statistical analysis, and risk assessment is essential for nutrition students. These skills enable critical evaluation of research findings and support evidence-based practice in nutrition science.
Additional info: The notes expand on brief points by providing definitions, formulas, and examples relevant to nutrition research, ensuring completeness and academic quality.
