 Back
BackTools for Achieving a Healthy Diet: Guidelines, Nutrient Density, and Food Choices
Study Guide - Smart Notes
 Tailored notes based on your materials, expanded with key definitions, examples, and context.
Tools for Healthful Eating
Principles of Good Nutrition
Good nutrition is essential for maintaining health, supporting growth, and optimizing bodily functions. The foods we consume have cumulative effects on our bodies, as many nutrients become integral components of our tissues and organs.
Key Point 1: Eating the right foods in the right amounts ensures adequate intake of essential nutrients.
Key Point 2: Proper nutrition helps prevent disease, supports growth, and enhances physical and mental performance.
Example: Protein and calcium from food are used in bone formation, illustrating the concept "You are what you eat."
Food Regulatory Agencies and Nutrition Guidelines
Regulatory Bodies and Their Roles
Several agencies regulate food safety, labeling, and nutrition guidelines in the United States. Their responsibilities ensure the public receives accurate information and access to safe, nutritious foods.
U.S. Department of Agriculture (USDA): Regulates meat, poultry, eggs, fresh fruit, and produce; establishes nutrition guidelines; runs SNAP benefits.
Food and Drug Administration (FDA): Regulates drugs, supplements, dairy, eggs, seafood, processed foods; oversees food labeling.
Institute of Medicine: Sets Dietary Reference Intakes (DRIs) through the National Academy of Sciences.
Dietary Reference Intakes (DRIs)
Types of DRIs and Their Purposes
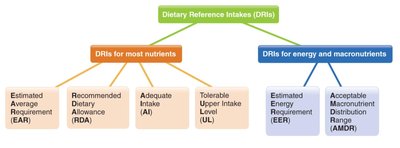
DRIs are a set of reference values used to assess and plan nutrient intakes for healthy people. They include several categories to address different nutritional needs and safety limits.
Estimated Average Requirement (EAR): The average daily nutrient intake level estimated to meet the requirements of half the healthy individuals in a group.
Recommended Dietary Allowance (RDA): The average daily intake sufficient to meet the nutrient requirements of nearly all (97-98%) healthy individuals.
Adequate Intake (AI): Used when evidence is insufficient to establish an RDA; based on observed or experimentally determined estimates.
Tolerable Upper Intake Level (UL): The highest daily intake unlikely to cause adverse health effects.
Estimated Energy Requirement (EER): The average dietary energy intake predicted to maintain energy balance.
Acceptable Macronutrient Distribution Range (AMDR): The range of intake for each macronutrient associated with reduced risk of chronic disease.
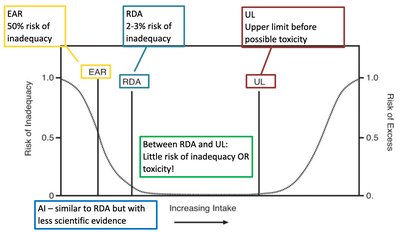
Risk of Inadequacy and Excess
The relationship between nutrient intake and risk of deficiency or toxicity is illustrated by the DRI model. Intakes below the EAR increase risk of inadequacy, while intakes above the UL increase risk of toxicity.
Key Point: The optimal intake lies between the RDA and UL, where risk of inadequacy and excess is minimal.
Example: AI is used when RDA cannot be determined due to limited scientific evidence.
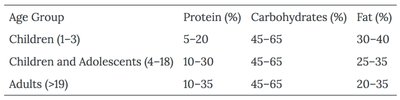
Acceptable Macronutrient Distribution Ranges (AMDR)
AMDRs specify the recommended percentage of calories from protein, carbohydrates, and fat for different age groups to promote health and reduce chronic disease risk.
Children (1-3 years): Protein 5-20%, Carbohydrates 45-65%, Fat 30-40%
Children and Adolescents (4-18 years): Protein 10-30%, Carbohydrates 45-65%, Fat 25-35%
Adults (>19 years): Protein 10-35%, Carbohydrates 45-65%, Fat 20-35%
Age Group | Protein (%) | Carbohydrates (%) | Fat (%) |
|---|---|---|---|
Children (1-3) | 5-20 | 45-65 | 30-40 |
Children and Adolescents (4-18) | 10-30 | 45-65 | 25-35 |
Adults (>19) | 10-35 | 45-65 | 20-35 |
Nutrition Facts Panel and % Daily Value (%DV)
Understanding Food Labels
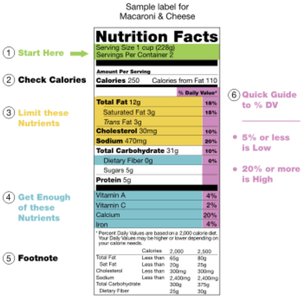
The Nutrition Facts Panel provides information about the nutrient content of packaged foods. %DV helps consumers understand how a food fits into their daily diet based on a 2,000 kcal reference.
%DV: Indicates the percentage of the daily recommended intake for each nutrient in one serving.
Key Point: %DV is not the same as RDA or AI and does not vary by sex or age.
Example: 5% DV or less is considered low; 20% DV or more is considered high.
Dietary Guidelines for Americans
Establishing Guidelines for Healthy Eating
The USDA uses DRIs to establish Dietary Guidelines, which provide evidence-based recommendations for healthy eating patterns. These guidelines are updated every five years.
A healthful diet is: Adequate, moderate, nutrient-dense, balanced, and varied.
Major Topics: Follow healthy dietary patterns at every life stage; customize choices to reflect preferences, traditions, and budgets; focus on nutrient-dense foods; limit added sugars, saturated fat, sodium, and alcohol.
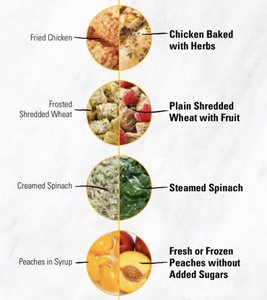
Nutrient-Dense Food Choices
What Are Nutrient-Dense Foods?
Nutrient-dense foods provide essential vitamins, minerals, fiber, and protein with relatively few calories from added sugars, solid fats, or refined starches. At least 85% of calories should come from nutrient-dense sources to meet requirements.
Examples: Vegetables (dark green, red, orange, legumes), whole fruits, whole grains, low-fat dairy, lean proteins, plant oils.
Key Point: Nutrient-dense foods are preferred for optimal health and disease prevention.

Evolution of Dietary Patterns
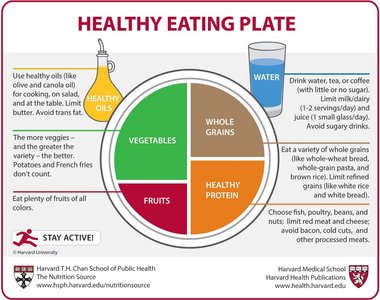
Food Pyramid, MyPyramid, and MyPlate
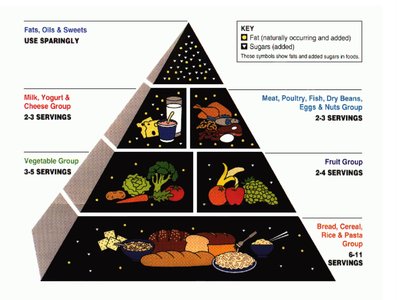
Visual guides have evolved to help Americans make healthier food choices. The Food Pyramid, MyPyramid, and MyPlate each emphasize balanced intake from all food groups.
Food Pyramid (1992): Emphasizes grains, vegetables, fruits, dairy, and protein, with fats and sweets used sparingly.
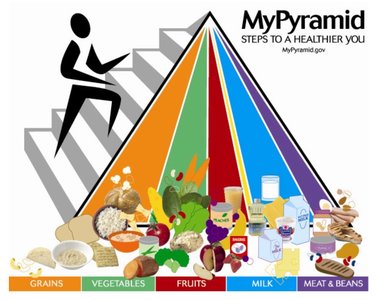
MyPyramid (2005): Adds physical activity and color-coded food groups.
MyPlate (2011): Simplifies the message with a plate divided into fruits, vegetables, grains, protein, and dairy.

Important Nutrients by Food Group
Grains
Grains are a primary source of dietary fiber, B vitamins (thiamin, riboflavin, niacin, folate), and minerals (iron, magnesium, selenium).

Vegetables
Vegetables provide potassium, dietary fiber, folate, vitamin A, and vitamin C.

Fruits
Fruits are rich in potassium, dietary fiber, vitamin C, and folate.

Protein Foods
Protein foods supply protein, B vitamins (niacin, thiamin, riboflavin, B6), vitamin E, iron, zinc, and magnesium.

Dairy
Dairy products are important sources of calcium, potassium, vitamin D, and protein.

Nutrient Density and Empty Calories
Definitions and Implications
Nutrient density measures the amount of beneficial nutrients per calorie in a food. Empty calories come from solid fats and added sugars, offering little nutritional value.
Nutrient-Dense Foods: High in vitamins, minerals, fiber, and protein; low in added sugars and solid fats.
Empty Calories: High in added sugars and solid fats; low in essential nutrients.
Key Point: Choosing nutrient-dense foods supports health, while excessive empty calories can lead to nutrient deficiencies and chronic disease.
Historic Attitudes Toward Nutrition
Changing Perspectives Over Time
Nutrition science has evolved from focusing on preventing starvation and deficiency diseases to optimizing health and preventing chronic diseases.
Pre-1840s: Focus on getting enough to eat; problems included starvation and malnutrition.
1840-1960: Discovery of nutrients; focus on preventing deficiency disorders (e.g., scurvy, rickets, anemia).
1960-1990: Identification of "good" and "bad" nutrients; focus on chronic diseases (e.g., cancer, heart disease, hypertension).
1990-present: Functional nutrients and optimization for health and fitness; issues include nutrition insecurity, confusion, and cost.
Obesity Trends and Portion Sizes
Impact of Dietary Patterns on Health
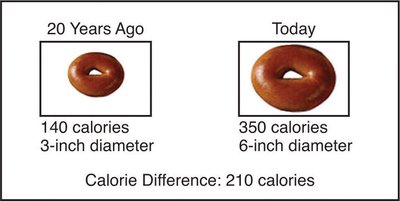
Obesity rates have increased significantly in the United States, partly due to larger portion sizes and increased consumption of calorie-dense, nutrient-poor foods.
Key Point: Average restaurant meals are much larger than in the past, contributing to higher calorie intake and weight gain.
Example: Adults are, on average, 26 pounds heavier than in the 1950s.

Food Processing and Its Effects
Levels of Food Processing
Foods can be classified by their degree of processing, which affects their nutrient content and health impact.
Whole or Minimally Processed: Foods prepared in home kitchens (e.g., fruits, vegetables, eggs, meats, yogurt, pickles).
Made from Refined and Extracted Ingredients: Includes flour, vegetable oil, sugar, fruit juice; helps preserve foods.
Highly Processed and Reconstituted: Foods broken down to molecules and reassembled with additives (e.g., hot dogs, chicken nuggets, Twinkies, soda).
Characteristics of Highly Processed Foods
Loss of original characteristics
Calorie-dense, nutrient-poor
Low in vitamins, minerals, and fiber
High in added sugars, saturated fats, and salt
High in refined grains, low in whole cells
Criticisms and Alternatives to Dietary Guidelines
Controversies and Improvements
The Dietary Guidelines for Americans have faced criticism for being influenced by political and economic interests, including the food industry. There are calls for stricter limits on added sugars and alcohol, and greater emphasis on sustainability and reduced meat consumption.
Key Point: Guidelines should prioritize health, sustainability, and evidence-based recommendations.
Example: Alternatives to highly processed foods include choosing fresh, whole, or minimally processed options.
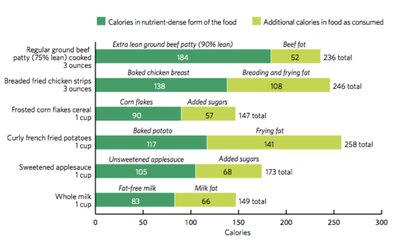
Summary Table: Nutrient Density vs. Empty Calories
Comparison of Food Choices
Food | Nutrient-Dense Form | Additional Calories (as consumed) |
|---|---|---|
Ground beef patty | Extra lean (184 kcal) | Beef fat (52 kcal) |
Chicken breast | Baked (138 kcal) | Breading/frying fat (108 kcal) |
Corn flakes | Regular (90 kcal) | Added sugars (57 kcal) |
French fries | Baked potato (117 kcal) | Frying fat (141 kcal) |
Applesauce | Unsweetened (105 kcal) | Added sugars (68 kcal) |
Milk | Fat-free (83 kcal) | Milk fat (66 kcal) |
Conclusion
Achieving a healthy diet requires understanding nutrition principles, regulatory guidelines, nutrient density, and the impact of food processing. By prioritizing nutrient-dense foods and following evidence-based dietary guidelines, individuals can optimize their health and reduce the risk of chronic disease.
