 Back
Chapter 1: Representing Motion – Physics with Algebra Study Notes
Study Guide - Smart Notes
 Tailored notes based on your materials, expanded with key definitions, examples, and context.
Representing Motion
Types of Motion
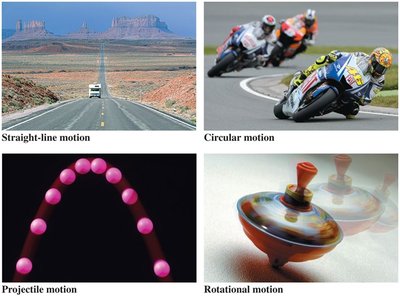
Motion is the change of an object’s position or orientation with time. The path along which an object moves is called its trajectory. There are several fundamental types of motion:
Straight-line motion: Movement along a single direction.
Circular motion: Movement along a circular path.
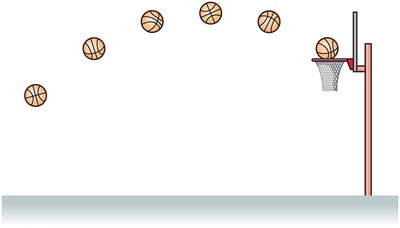
Projectile motion: Movement under the influence of gravity, typically following a parabolic path.
Rotational motion: Movement around an axis.
Motion Diagrams
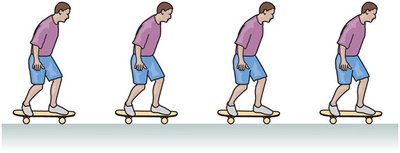
Motion diagrams are visual representations of an object's position at successive times. They help analyze how an object moves:
Constant speed: Equal spacing between positions (e.g., skateboarder).
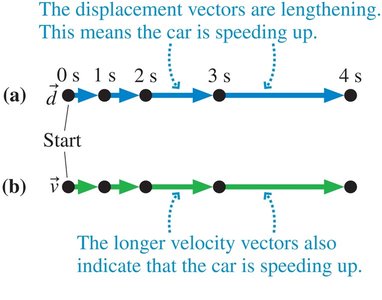
Speeding up: Increasing spacing between positions (e.g., runner).
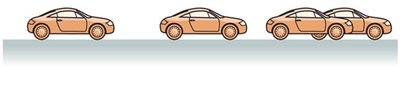
Slowing down: Decreasing spacing between positions (e.g., car).

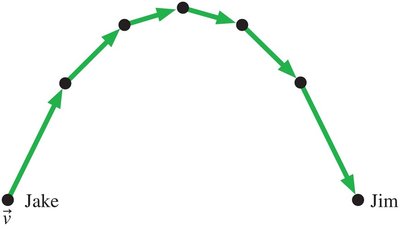
Motion in two dimensions involves changes in both speed and direction.
Comparing Motion Using Diagrams
Motion diagrams can be used to compare the speed of different objects. For example, if two cars have the same time interval between photos, the car with less distance between positions is moving slower.


Models and Modeling
Descriptive and Explanatory Models
Models are simplified representations of nature that capture essential features. There are two main types:
Descriptive models: Describe properties in the simplest terms.
Explanatory models: Use laws of physics to predict behavior.
The Particle Model
The particle model treats a moving object as if all its mass were concentrated at a single point. This simplification is useful for analyzing motion.
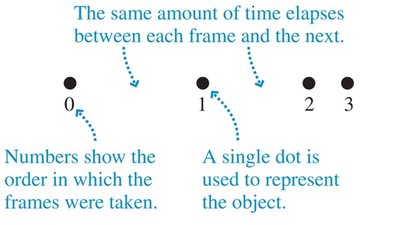
Position and Time: Putting Numbers on Nature
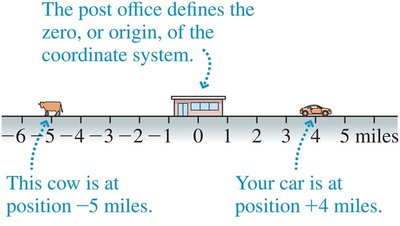
Position and Coordinate Systems
To specify position, a reference point (origin), distance from the origin, and direction are needed. The combination of an origin and an axis marked in both positive and negative directions forms a coordinate system.
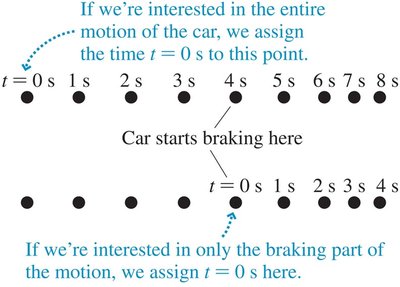
Time in Motion Diagrams
Each frame in a motion diagram is labeled with its corresponding time, denoted by the symbol t.
Displacement and Time Intervals
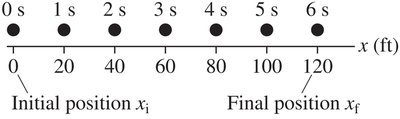
Displacement is the difference between a final position and an initial position:
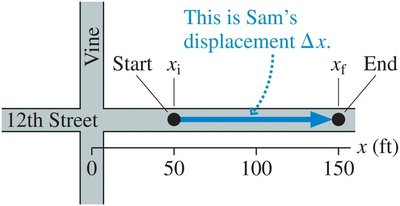
Time interval measures the elapsed time as an object moves from an initial position at time to a final position at time :
Example: Displacement Calculation
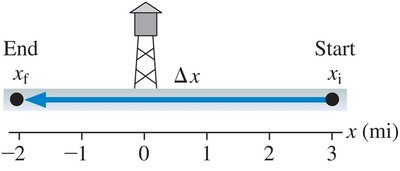
Emily starts 3 miles east of a water tower and ends 2 miles west after half an hour. Her displacement is:
miles
Velocity
Speed and Velocity
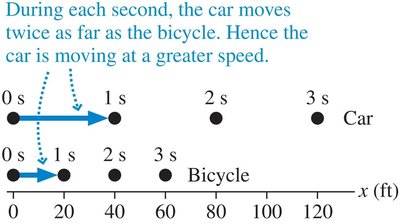
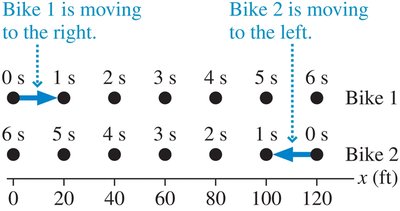
Speed is the distance traveled in a given time interval. Velocity includes both speed and direction:
Example: Velocity Calculation
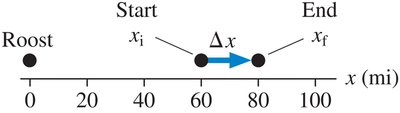
An albatross moves from 60 miles east to 80 miles east in 15 minutes (0.25 hours):
miles
hours
miles/hour
Significant Figures, Scientific Notation, and Units
Measurements and Significant Figures
Measurements are limited by precision. Significant figures are digits that are reliably known. Rules for significant figures:
All non-zero numbers are significant.
Zeros between non-zero digits are significant.
Leading zeros are not significant.
Trailing zeros to the right of the decimal are significant.
Trailing zeros in a whole number with a decimal are significant.
Trailing zeros in a whole number with no decimal are not significant.
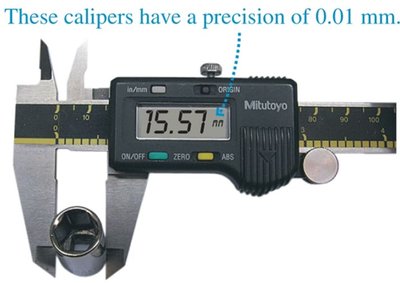
Using Significant Figures in Calculations
Multiplication/division: Answer should have the same number of significant figures as the least precise number.
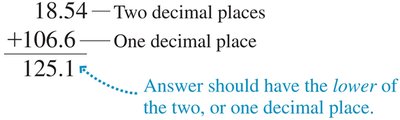
Addition/subtraction: Answer should have the same number of decimal places as the least precise number.

Scientific Notation
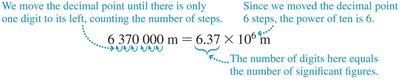
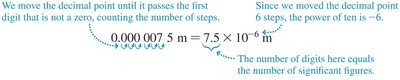
Scientific notation is used to express very large or small numbers clearly and to show significant figures:
For numbers greater than 10: Move the decimal left, count steps, multiply by .
For numbers less than 1: Move the decimal right, count steps, multiply by .
SI Units and Prefixes
The International System of Units (SI) is used in science. Common SI units:
Time: second (s)
Length: meter (m)
Mass: kilogram (kg)
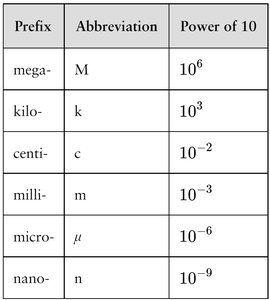
Prefixes denote powers of ten:
Prefix | Abbreviation | Power of 10 |
|---|---|---|
mega- | M | |
kilo- | k | |
centi- | c | |
milli- | m | |
micro- | μ | |
nano- | n |
Conversions Between Measurement Systems
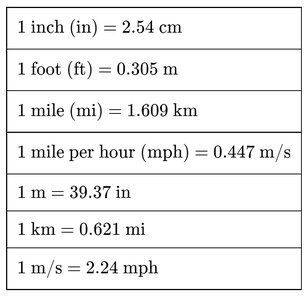
Conversion between SI and English units is often necessary. Common conversion factors:
Unit | Conversion |
|---|---|
1 inch (in) | 2.54 cm |
1 foot (ft) | 0.305 m |
1 mile (mi) | 1.609 km |
1 mile per hour (mph) | 0.447 m/s |
1 m | 39.37 in |
1 km | 0.621 mi |
1 m/s | 2.24 mph |
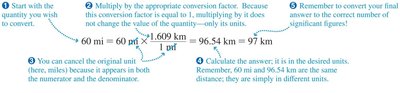
Unit conversion steps:
Start with the quantity you wish to convert.
Multiply by the appropriate conversion factor.
Cancel the original unit.
Calculate the answer in the desired units.
Report the answer with the correct number of significant figures.
Vectors and Motion: A First Look
Scalars and Vectors
A scalar is described by a single number and unit. A vector has both magnitude and direction, represented graphically as an arrow.

Displacement Vectors
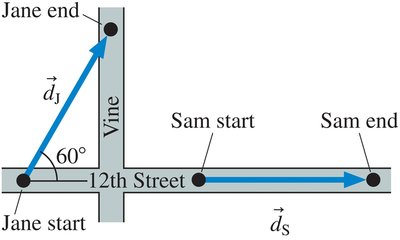
The displacement vector shows the distance and direction of an object's motion, drawn from initial to final position.
Vector Addition
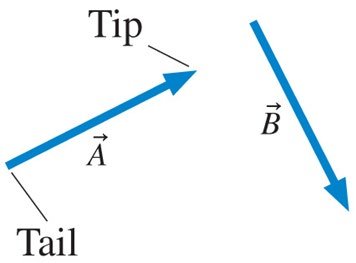
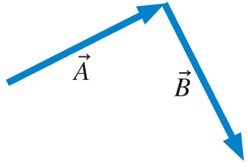
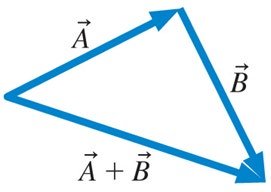
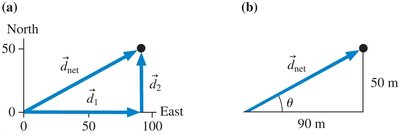
The net displacement for a trip with two legs is the sum of the two displacement vectors. To add vectors:
Draw vector A.
Place the tail of vector B at the tip of A.
Draw an arrow from the tail of A to the tip of B. This is vector A + B.

Vectors and Trigonometry
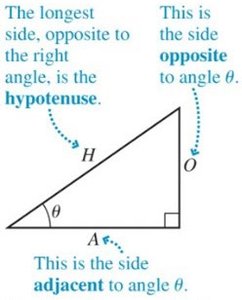
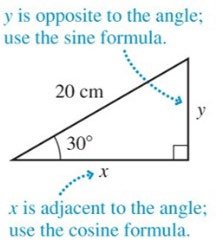
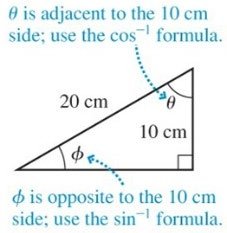
Trigonometry is used to calculate lengths and angles of triangles, especially with vectors. The sides of a right triangle are related by the Pythagorean theorem:
Sine, cosine, and tangent of angle are defined as:
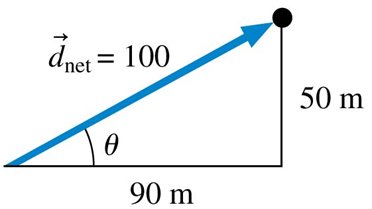
Example: Vector Addition and Displacement
Anna walks 90 m east and then 50 m north. Her net displacement is:
Magnitude: m
Direction: north of east
Velocity Vectors
The velocity vector points in the direction of motion and its magnitude is the object's speed.
Example: Motion Diagram with Velocity Vectors
A ball is hit at a 60° angle and caught. The motion diagram shows velocity vectors changing in length and direction, indicating changes in speed and direction.
Summary
This chapter introduced fundamental concepts of motion, including types of motion, motion diagrams, models, position, displacement, velocity, significant figures, scientific notation, units, vectors, and vector addition. These concepts form the foundation for analyzing motion in physics.
