
Calculating Change in Velocity from Acceleration-Time Graphs quiz #1 Flashcards

Calculating Change in Velocity from Acceleration-Time Graphs quiz #1
Control buttons has been changed to "navigation" mode.
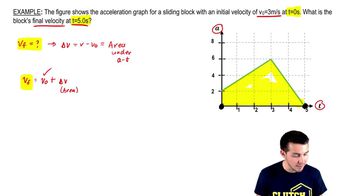
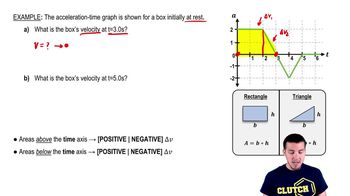
1/10
  • How do you determine the change in velocity of an object during a 1-second interval using an acceleration-time graph?
    To determine the change in velocity during a 1-second interval using an acceleration-time graph, calculate the area under the acceleration curve for that interval. The area (using appropriate geometric formulas for rectangles or triangles) gives the change in velocity (Δv) for that time period.
  • Which equation is most appropriate for determining acceleration from a velocity versus time graph?
    The most appropriate equation is: acceleration (a) = change in velocity (Δv) divided by change in time (Δt), or a = (v_final - v_initial) / (t_final - t_initial).
  • How do you compare the change in velocity for different time intervals using an acceleration-time graph?
    To compare the change in velocity for different time intervals using an acceleration-time graph, calculate the area under the curve for each interval. The interval with the largest area (considering sign) corresponds to the greatest change in velocity, and the smallest area corresponds to the lowest change.
  • What is the general method for finding the change in velocity from an acceleration-time graph?
    The general method is to calculate the area under the acceleration-time graph between the start and end times of interest. This area represents the change in velocity (Δv) over that time period.
  • If a particle undergoes a displacement of magnitude 54 m in a direction 42 degrees below the x-axis, how can you express its displacement vector in terms of its x and y components?
    The displacement vector can be expressed as: x-component = 54 cos(42°), y-component = -54 sin(42°), where the negative sign indicates the direction is below the x-axis.
  • How do you find the velocity at a specific time if the object starts from rest using an acceleration-time graph?
    Calculate the total area under the acceleration-time graph from t=0 to the desired time. Since the initial velocity is zero, this area directly gives the velocity at that time.
  • What geometric shapes are commonly used to break down the area under an acceleration-time graph for calculation?
    Rectangles and triangles are commonly used to divide the area under the curve. This simplifies the calculation of the total area, which represents the change in velocity.
  • Why must you consider the sign of the area under the acceleration-time graph when calculating velocity?
    The sign indicates whether the acceleration is positive or negative, affecting whether the velocity increases or decreases. Areas below the time axis represent negative acceleration and thus negative changes in velocity.
  • If two triangles under the acceleration-time graph are symmetrical but below the time axis, how do they affect the total velocity?
    Both triangles contribute equally but negatively to the total change in velocity. Their combined effect is to decrease the velocity by the sum of their absolute areas.
  • What is the relationship between the area under an acceleration-time graph and the object's velocity if the initial velocity is zero?
    The area under the graph from the start time to a given time equals the object's velocity at that time. This is because the change in velocity is the same as the final velocity when starting from rest.