Skip to main content
Physics with Calculus
My Course
Learn
Exam Prep
AI Tutor
Study Guides
Textbook Solutions
Flashcards
Explore
Try the app
My Course
Learn
Exam Prep
AI Tutor
Study Guides
Textbook Solutions
Flashcards
Explore
Try the app
Back
Physics with Calculus: Key Concepts and Graph Analysis
You can tap to flip the card.
What does a position vs. time graph with a horizontal line indicate about the object's motion?
You can tap to flip the card.
👆
What does a position vs. time graph with a horizontal line indicate about the object's motion?
The object is at rest because its position does not change over time.
Track progress
Control buttons has been changed to "navigation" mode.
1/20
Recommended videos
Guided course
07:41
Intro to Position-Time Graphs & Velocity
23792
views
608
rank
4
comments
Guided course
03:04
Curved Position-Time Graphs & Acceleration
16839
views
400
rank
1
comments
Guided course
06:28
Position-Time Graphs and Instantaneous Velocity
14672
views
360
rank
1
comments
Terms in this set (20)
Hide definitions
What does a position vs. time graph with a horizontal line indicate about the object's motion?
The object is at rest because its position does not change over time.
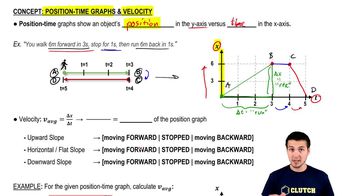
How is constant velocity represented on a position vs. time graph?
By a straight line with a constant positive or negative slope.
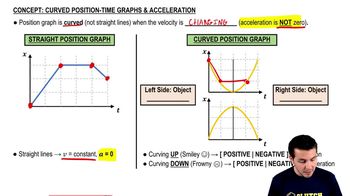
What does a curved position vs. time graph indicate about the object's motion?
The object is accelerating, meaning its velocity is changing over time.
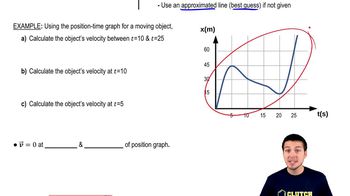
Describe the motion of an object between 0 and 5 seconds if the position vs. time graph shows a curve increasing from 20 m to 108 m.
The object is accelerating positively, increasing its velocity over this interval.
What does a positive slope on a position vs. time graph between 5 and 14 seconds indicate?
The object is moving with a constant positive velocity.
What does a negative slope on a position vs. time graph between 14 and 29 seconds indicate?
The object is moving with a constant negative velocity.
What does a horizontal line on a position vs. time graph between 29 and 32 seconds indicate?
The object is at rest during this time interval.
What does a steep positive slope on a position vs. time graph between 32 and 33 seconds indicate?
The object is moving with a high positive velocity.
How would the velocity vs. time graph look for an object accelerating from rest between 0 and 5 seconds?
The velocity vs. time graph would show a curve increasing from zero velocity upwards.
How is constant positive velocity represented on a velocity vs. time graph?
By a horizontal line above the time axis.
How is constant negative velocity represented on a velocity vs. time graph?
By a horizontal line below the time axis.
What does a zero velocity on a velocity vs. time graph indicate?
The object is at rest.
How is acceleration represented on a velocity vs. time graph?
By a line with a nonzero slope; positive slope means positive acceleration, negative slope means negative acceleration.
What is the formula for average velocity?
Average velocity = \(\frac{\Delta x}{\Delta t}\), where
\(\Delta\) x
is displacement and
\(\Delta\) t
is time interval.
What is the formula for acceleration?
Acceleration = \(\frac{\Delta v}{\Delta t}\), where
\(\Delta\) v
is change in velocity and
\(\Delta\) t
is time interval.
What does a positive acceleration mean in terms of velocity?
Velocity is increasing over time.
What does a negative acceleration mean in terms of velocity?
Velocity is decreasing over time.
How can you determine if an object is speeding up or slowing down from a velocity vs. time graph?
If velocity and acceleration have the same sign, the object is speeding up; if opposite signs, it is slowing down.
What is displacement?
Displacement is the change in position of an object, a vector quantity with direction.
What is the difference between speed and velocity?
Speed is scalar and only magnitude; velocity is vector and includes direction.
 BackBack
 07:41