 Back
1D Kinematics: Concepts, Motion Diagrams, and Graphical Analysis
Study Guide - Smart Notes
 Tailored notes based on your materials, expanded with key definitions, examples, and context.
1D Kinematics
Kinematics Overview
Kinematics is the branch of mechanics that describes the motion of objects without considering the causes of motion. In one-dimensional (1D) kinematics, we focus on motion along a straight line, analyzing how position, velocity, and acceleration change over time.
Distance and Displacement
Distance (x): The total length of the path traveled by an object. It is a scalar quantity and measured in meters (m).
Displacement (Δx): The change in position of a particle, calculated as the final position minus the initial position. Displacement is a vector quantity, also measured in meters (m).
Key Difference: Distance measures the total path length, while displacement measures the straight-line change from start to finish.
Example: If you walk 50 m east and then 50 m west, your distance is 100 m, but your displacement is 0 m.
Distance vs. Displacement Example
Consider a car driving around a circular track of diameter 40 meters for 2.5 laps:
Distance traveled:
Displacement: The straight-line distance from the starting point to the final position, which is 40 m (the diameter of the circle).
Motion Diagrams
Making a Motion Diagram
A motion diagram is a sequence of images showing an object's position at equally spaced time intervals. It helps visualize how an object moves over time.
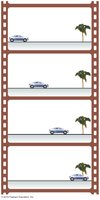
By stacking individual frames, we create a composite image that shows the object's position at several instants.
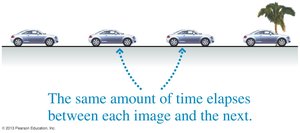
Examples of Motion Diagrams
At Rest: An object with a single position in a motion diagram is stationary.
Constant Speed: Equally spaced images indicate constant speed.
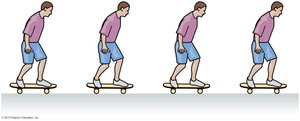

Speeding Up: Increasing distance between images shows acceleration.
Slowing Down: Decreasing distance between images shows deceleration.
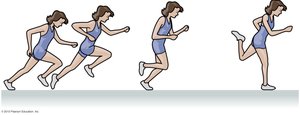

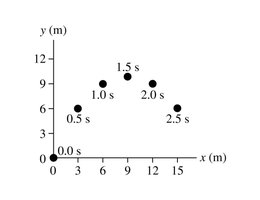
Complex Motion: Motion diagrams can also represent two-dimensional motion, such as a basketball shot.
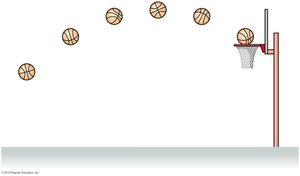
Comparing Motion Diagrams
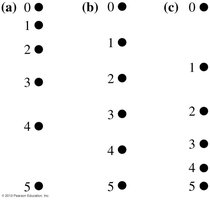
When comparing two objects with the same time interval between images, the one with images closer together is moving slower.

The Particle Model
In kinematics, we often simplify objects as particles—points with mass but no size or shape. This allows us to focus on the motion of the object's center of mass.
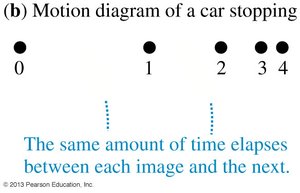
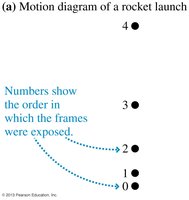
Interpreting Motion Diagrams
Motion diagrams can be used to distinguish between different types of motion, such as constant speed, speeding up, or slowing down.
Position and Time
Adding a coordinate system to a motion diagram allows us to specify the object's position at each time. For example, a basketball's position at different times can be plotted as (x, y) coordinates.
Speed and Velocity
Average Speed and Average Velocity
Average Speed: How fast a particle is moving, calculated as total distance divided by total time.
Average Velocity: How fast displacement changes with time, calculated as total displacement divided by total time. The sign indicates direction.
Formulas:
Average speed:
Average velocity:
Graphical Analysis of 1D Motion
Position vs. Time Graphs
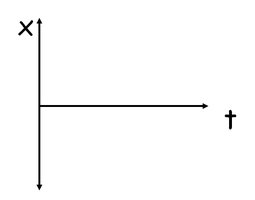
Position-time graphs visually represent how an object's position changes over time. The slope of the graph gives the velocity.
Determining Average Velocity from a Graph
The average velocity between two points (A and B) on a position-time graph is the slope of the line connecting those points:

Acceleration
Definition of Acceleration
Acceleration is any change in velocity over time. It is a vector quantity, and its sign indicates direction, not whether the object is speeding up or slowing down.
If velocity and acceleration have the same sign, the object speeds up.
If velocity and acceleration have opposite signs, the object slows down.
Average Acceleration Formula:
Instantaneous Speed, Velocity, and Acceleration
Instantaneous Velocity from a Graph
The instantaneous velocity at a point on a position-time graph is the slope of the tangent line at that point.






Instantaneous Acceleration
Instantaneous acceleration is the slope of the tangent line to a velocity-time graph at a specific instant.


Calculus in Kinematics
Instantaneous velocity: The derivative of position with respect to time.
Instantaneous acceleration: The derivative of velocity with respect to time, or the second derivative of position with respect to time.
Formulas:
Velocity:
Acceleration:





Summary Table: Key Quantities in 1D Kinematics
Quantity | Definition | Type | SI Unit |
|---|---|---|---|
Distance (x) | Total path length traveled | Scalar | Meter (m) |
Displacement (Δx) | Change in position (final - initial) | Vector | Meter (m) |
Speed | Distance per unit time | Scalar | Meter/second (m/s) |
Velocity | Displacement per unit time | Vector | Meter/second (m/s) |
Acceleration | Change in velocity per unit time | Vector | Meter/second² (m/s²) |
Additional info: Calculus is essential for determining instantaneous quantities in kinematics, especially when position is given as a function of time. The "Power Rule" is commonly used for differentiating polynomial functions.
