 Back
BackAnalyzing Displacement and Distance from a Velocity-Time Graph
Study Guide - Smart Notes
 Tailored notes based on your materials, expanded with key definitions, examples, and context.
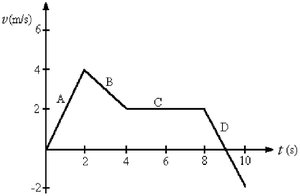
Q1. For the velocity vs. time graph shown, find:
(a) The net displacement of the player over the 10 seconds.
(b) The total distance run by the player over the 10 seconds.
Background
Topic: Kinematics – Interpreting Velocity-Time Graphs
This question tests your ability to analyze a velocity-time graph to determine displacement and total distance traveled. The area under the velocity-time curve represents displacement, while the sum of the absolute values of the areas gives the total distance.
Key Terms and Formulas
Displacement (): The net change in position, found by calculating the signed area under the velocity-time graph.
Total Distance: The sum of the magnitudes of all areas under the velocity-time graph (treat all areas as positive).
Key formula for displacement:
For straight-line segments, the area under the curve can be found using the area of geometric shapes (rectangles, triangles, trapezoids).
Step-by-Step Guidance
Break the graph into segments (A, B, C, D) where the velocity changes linearly or remains constant. Identify the time intervals for each segment.
For each segment, calculate the area under the curve. Use the appropriate geometric formula (e.g., area of a triangle: , area of a rectangle: ).
For net displacement, add the signed areas (areas above the time axis are positive, below are negative).
For total distance, add the absolute values of all areas (ignore the sign).
Try solving on your own before revealing the answer!
