 Back
Chapter 1: Concepts of Motion – Foundations for Physics with Calculus
Study Guide - Smart Notes
 Tailored notes based on your materials, expanded with key definitions, examples, and context.
Concepts of Motion
Introduction to Mechanics and Units
Mechanics is the branch of physics that studies motion and the forces that cause it. Understanding motion begins with the use of standard units to measure physical quantities. The International System of Units (SI) provides a foundation for all measurements in physics.
Base SI Units: meter (m) for length, second (s) for time, kilogram (kg) for mass.
Other SI Base Units: ampere (electric current), kelvin (temperature), mole (amount of substance), candela (luminous intensity).
Derived Units: Many physical quantities are combinations of base units, e.g., velocity (m/s), acceleration (m/s2), force (kg·m/s2).
Unit Conversions: Physics problems often require converting between SI and non-SI units. For example, 1 meter = 100 centimeters, 1 meter = 3.281 feet, 1 kilometer = 1000 meters, 1 mile = 1609.34 meters, 1 kilogram = 2.205 pounds, 1 kilogram = 1000 grams.
Example: To convert a velocity of 242 miles per hour to SI units (m/s), use the conversion factors for miles to meters and hours to seconds.
Types of Motion
Motion can be classified into several types based on the path and nature of movement. Understanding these types is essential for analyzing physical systems.
Linear Motion: Movement along a straight path.
Circular Motion: Movement along a circular path.
Projectile Motion: Curved path under the influence of gravity.
Rotational Motion: Object rotates about an axis, changing its orientation.
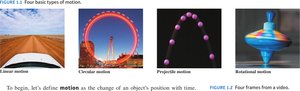
Translational motion includes linear, circular, and projectile motion, where the object changes position in space.
Motion Diagrams
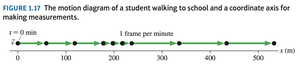
Motion diagrams are visual tools that represent an object's position at successive time intervals. They help in understanding how an object's speed and direction change over time.
Equal spacing: Indicates constant speed.
Increasing spacing: Indicates the object is speeding up.
Decreasing spacing: Indicates the object is slowing down.

Comparing Speeds Using Motion Diagrams
By comparing the spacing between positions in motion diagrams, we can determine which object is moving faster.
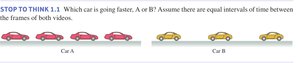
Key Point: Greater spacing between positions in equal time intervals means higher speed.
Position and Location in Two Dimensions
Position describes the location of an object relative to an origin in a coordinate system. In two dimensions, position is given by coordinates (x, y).
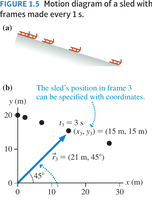
Example: The position of a sled at time t3 can be specified as (x3, y3).
Scalars vs. Vectors
Physical quantities are classified as scalars or vectors:
Scalars: Have magnitude only (e.g., time, mass, temperature, speed).
Vectors: Have both magnitude and direction (e.g., position, displacement, velocity, acceleration).
Example Classification: 20 m/s EAST (vector), 20 m/s (scalar), −5 °C (scalar), 3 kg (scalar).
Displacement Vector
Displacement is a vector that represents the change in position of an object. It points from the initial position to the final position.
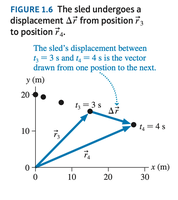
Formula:
Vector Addition and Subtraction
Vectors are added graphically by placing the tail of one at the tip of the other. Subtraction is performed by adding the negative of a vector.
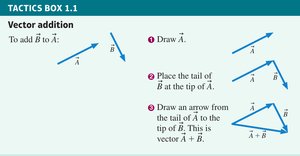
Vector Addition:
Vector Subtraction:
Motion Diagrams with Displacement Vectors
Displacement vectors can be drawn on motion diagrams to show the change in position between successive time intervals.
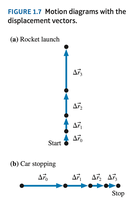
Average Speed vs. Average Velocity
Average speed is the total distance traveled divided by the total time, while average velocity is the displacement divided by the total time. If an object returns to its starting point, its average velocity is zero, but its average speed is not.
Formula for Average Velocity:
Formula for Average Speed:
Velocity Vectors
A velocity vector gives both the speed and direction of motion. The arrow points in the direction of motion, and its length represents the magnitude (speed).
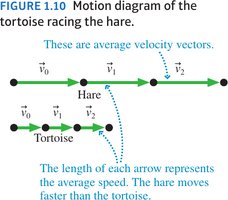
Key Point: Objects with the same speed but different directions have different velocity vectors.
Linear Acceleration
Acceleration is the rate at which velocity changes. Velocity can change by altering its magnitude (speeding up or slowing down) or its direction.
Formula:
Acceleration Vectors on Motion Diagrams
Acceleration vectors are found by determining the change in velocity vectors between two points. The direction of the acceleration vector indicates whether the object is speeding up or slowing down.
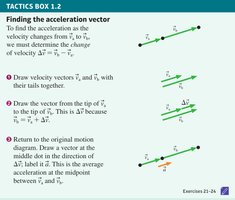
Acceleration at the Top of a Tossed Ball’s Flight
At the highest point of a tossed ball's flight (ignoring air resistance), the velocity is momentarily zero, but the acceleration due to gravity is not zero and points downward.
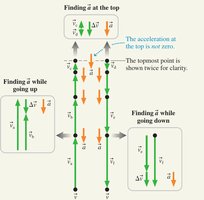
Relationship Between Velocity and Acceleration Directions
The direction of velocity and acceleration vectors determines whether an object speeds up or slows down:
Same direction: Object speeds up.
Opposite directions: Object slows down.
Zero acceleration: Velocity is constant.
Signs of Position, Velocity, and Acceleration
The sign (positive or negative) of position, velocity, and acceleration indicates direction relative to a chosen origin and axis.
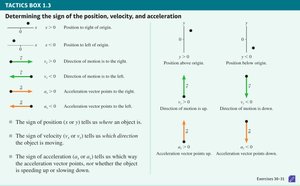
Position (x, y): Where the object is relative to the origin.
Velocity (vx, vy): Direction of motion.
Acceleration (ax, ay): Direction of change in velocity.
Position vs. Time Graphs
Position vs. time graphs visually represent how an object's position changes over time. The slope of the graph at any point gives the object's velocity.
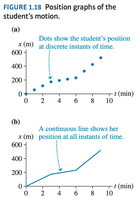
Reading Motion Stories from Graphs
Position vs. time graphs can be interpreted as stories of motion, showing periods of movement, rest, and changes in direction.
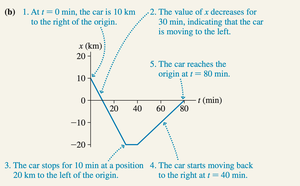
Example: A car starts at 10 km right of the origin, moves left, stops, then returns right, as shown by changes in the graph's slope and direction.
