 Back
BackChapter 1: Concepts of Motion – Foundations of Kinematics
Study Guide - Smart Notes
 Tailored notes based on your materials, expanded with key definitions, examples, and context.
Concepts of Motion
Introduction to Motion
Motion is a fundamental concept in physics, describing the change in an object’s position over time. Understanding motion is essential for analyzing physical systems and predicting future behavior.
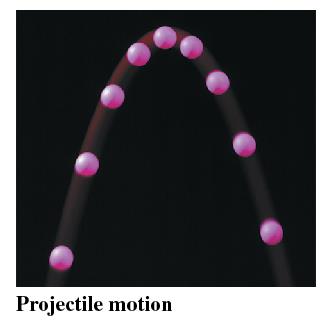
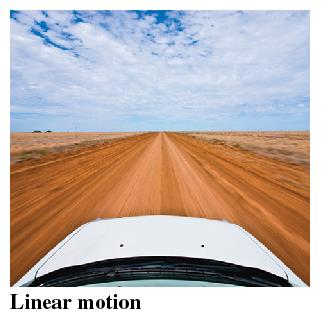
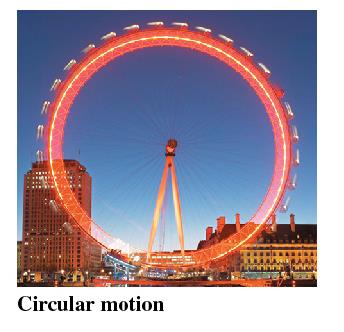
Translational Motion: The object moves through space, and its trajectory can be linear, parabolic, or circular.
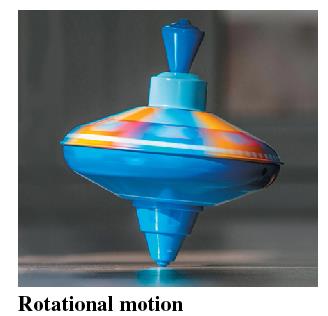
Rotational Motion: The object rotates about an axis but does not translate through space.
There are four basic types of motion commonly studied in introductory physics:
Type of Motion | Description |
|---|---|
Linear Motion | Movement along a straight path |
Projectile Motion | Curved, parabolic trajectory under gravity |
Circular Motion | Movement along a circular path |
Rotational Motion | Rotation about an internal axis |
Describing Motion: Motion Diagrams
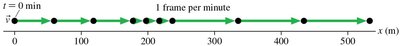
Constructing Motion Diagrams
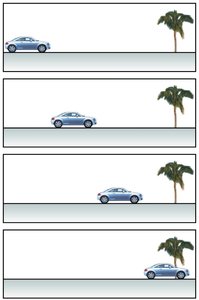
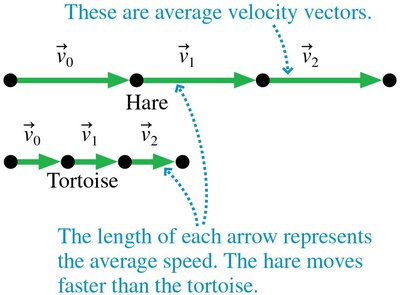
A motion diagram is a visual tool that shows an object’s position at successive, equally spaced time intervals. It helps in analyzing how an object moves over time.
Each frame in a motion diagram represents the object’s position at a specific instant.
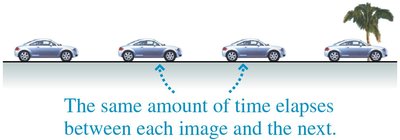
Composite images can be created by layering frames, making patterns of motion visible.
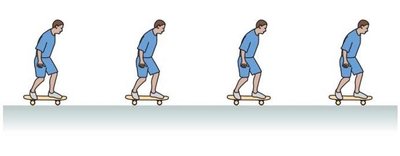
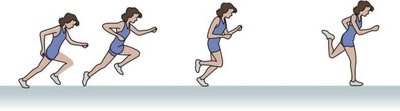
Equally spaced images indicate constant speed; increasing spacing shows acceleration.

The Particle Model
To simplify analysis, complex objects are often modeled as particles, concentrating all mass at a single point. This particle model allows us to focus on the motion of the center of mass.
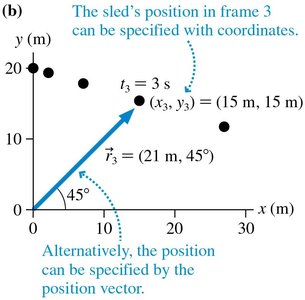
Each position in the diagram is labeled with coordinates, such as (x0, y0).
Coordinate systems are chosen by the observer and may differ between individuals.

Vectors and Scalars
Definitions and Examples
Physical quantities are classified as either scalars or vectors:
Scalar: Described by a single number and unit (e.g., mass, time, temperature).
Vector: Described by both magnitude and direction (e.g., velocity, acceleration, force).
Position and Displacement Vectors
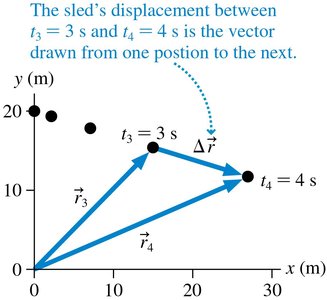
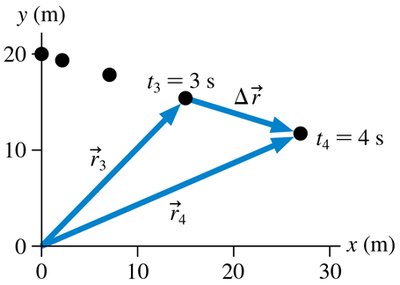
The position vector (\( \vec{r} \)) locates an object relative to the origin of a coordinate system. The displacement vector (\( \Delta \vec{r} \)) points from an initial to a final position.
Magnitude of \( \vec{r} \) gives the distance from the origin.
\( \Delta \vec{r} = \vec{r}_f - \vec{r}_i \)
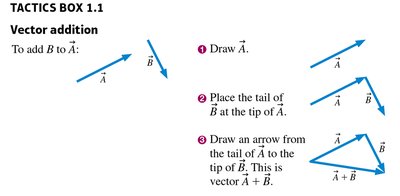
Vector Addition and Subtraction
Vectors are added graphically by placing them head-to-tail. The resultant vector closes the triangle. Subtraction is performed by adding the negative of a vector.
\( \vec{A} + \vec{B} \) is found by drawing \( \vec{B} \) from the tip of \( \vec{A} \).
\( \vec{A} - \vec{B} = \vec{A} + (-\vec{B}) \)
Time, Speed, and Velocity
Time Interval
The time interval (\( \Delta t \)) is the difference between two time readings. Displacement over a time interval gives average velocity.
\( \Delta t = t_f - t_i \)
\( \Delta \vec{r} \) occurs during \( \Delta t \)
Average Speed and Velocity
Average speed: \( \text{Average speed} = \frac{\text{distance traveled}}{\text{time taken}} = \frac{d}{\Delta t} \)
Average velocity: \( \vec{v}_{\text{avg}} = \frac{\Delta \vec{r}}{\Delta t} \)
Speed is a scalar; velocity is a vector.
Acceleration
Linear Acceleration
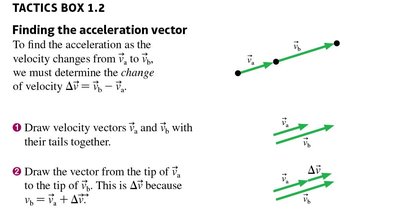
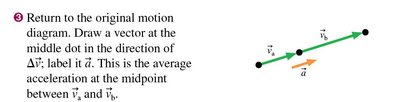
Acceleration is the rate of change of velocity. It is a vector quantity.
\( \vec{a}_{\text{avg}} = \frac{\vec{v}_2 - \vec{v}_1}{t_2 - t_1} = \frac{\Delta \vec{v}}{\Delta t} \)
Acceleration vectors are drawn at the midpoint between velocity vectors.
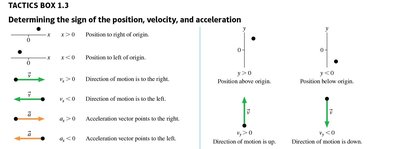
Speeding Up or Slowing Down
If \( \vec{a} \) points in the same direction as \( \vec{v} \), the object speeds up.
If \( \vec{a} \) points opposite to \( \vec{v} \), the object slows down.
If \( \vec{a} = 0 \), the object moves at constant velocity.
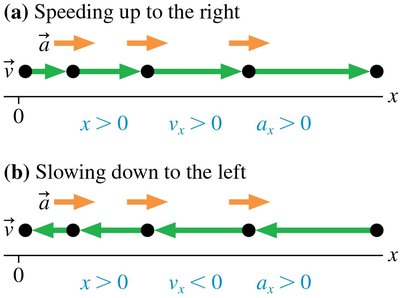
Determining Signs of Position, Velocity, and Acceleration
The sign of a vector component indicates its direction relative to the chosen coordinate system.
Positive or negative values for position, velocity, and acceleration depend on the defined axes.
Graphical Representation of Motion
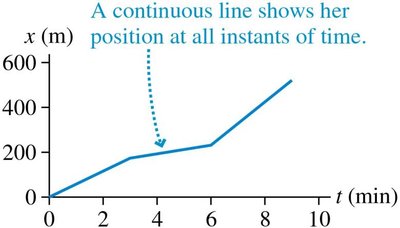
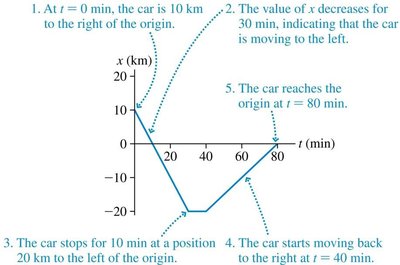
Position vs. Time Graphs
Position-time graphs provide a continuous representation of an object’s motion. The slope of the graph at any point gives the velocity.
Steeper slopes indicate higher speeds.
Changes in slope indicate acceleration.
Units and Measurement
SI Units
Physics relies on the International System of Units (SI), which standardizes measurements for clarity and consistency.
Base units: meter (m) for length, kilogram (kg) for mass, second (s) for time.
Derived units: Formed from combinations of base units (e.g., m/s for velocity).
Prefixes: Used to express very large or small quantities (e.g., kilo-, milli-, micro-).
Unit Conversions
Converting between units is essential for solving physics problems. Conversion factors are ratios equal to one, allowing units to be changed without altering the value.
Conversion | Value |
|---|---|
1 in = | 2.54 cm |
1 mi = | 1.609 km |
1 mph = | 0.447 m/s |
1 m = | 39.37 in |
1 km = | 0.621 mi |
1 m/s = | 2.24 mph |
Significant Figures
Precision and Reporting
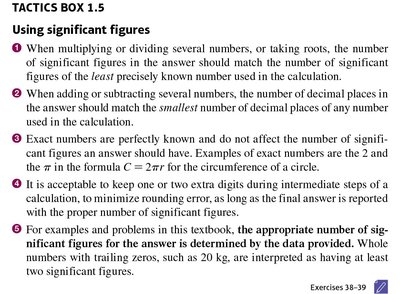
Significant figures reflect the precision of measurements and calculations. The number of significant figures in a result should not exceed that of the least precise measurement.
When multiplying/dividing, use the least number of significant figures from the inputs.
When adding/subtracting, match the smallest number of decimal places.
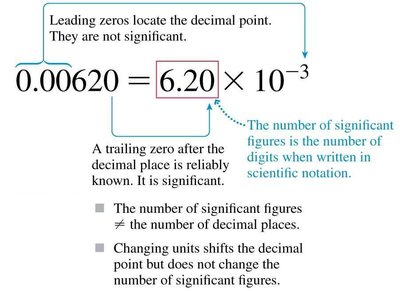
Scientific notation clarifies the number of significant figures.
Examples
Expressing 1200 kg to three significant figures: kg
Calculating mass from density and volume:
Final answers should be rounded to the correct number of significant figures based on the data provided.
Additional info: This guide covers the foundational concepts of motion, vectors, and measurement, providing the essential tools for further study in kinematics and dynamics.
