 Back
BackChapter 18: A Macroscopic Description of Matter – Study Notes
Study Guide - Smart Notes
 Tailored notes based on your materials, expanded with key definitions, examples, and context.
Macroscopic Description of Matter
Phases of Matter
The three primary phases of matter—solid, liquid, and gas—are distinguished by their structural and dynamic properties at the atomic level.
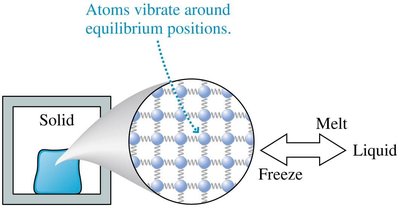
Solids: Atoms are arranged in a rigid structure and vibrate around fixed equilibrium positions. Solids maintain a definite shape and volume due to strong molecular bonds.
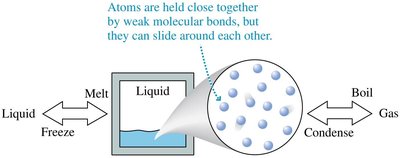
Liquids: Atoms are held close together by weak molecular bonds, allowing them to slide past one another. Liquids are nearly incompressible and take the shape of their container.
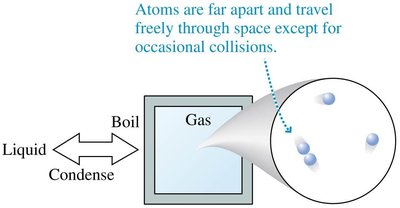
Gases: Atoms are far apart and move freely, only interacting during occasional collisions. Gases are highly compressible and fill the entire volume of their container.
Phase Transitions: Matter can change phases through melting, freezing, boiling, and condensation.
State Variables
State variables are macroscopic quantities used to describe the condition of a system. Common state variables include mass, volume, pressure, temperature, and density.
Mass Density (\(\rho\)): The ratio of mass (M) to volume (V) of a material.
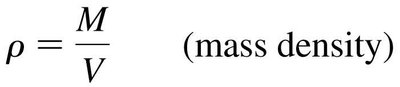
Units: SI unit for density is kg/m3.
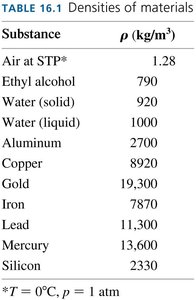
Material Densities: Different substances have characteristic densities.
Substance | Density (kg/m3) |
|---|---|
Air at STP | 1.28 |
Ethyl alcohol | 790 |
Water (solid) | 920 |
Water (liquid) | 1000 |
Aluminum | 2700 |
Copper | 8920 |
Gold | 19300 |
Iron | 7870 |
Lead | 11300 |
Mercury | 13600 |
Silicon | 2330 |
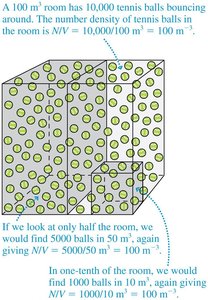
Number Density
Number density quantifies the number of atoms or molecules per unit volume in a system.
Formula: Number density is given by \(\frac{N}{V}\), where N is the number of particles and V is the volume.
Units: SI unit is m-3.

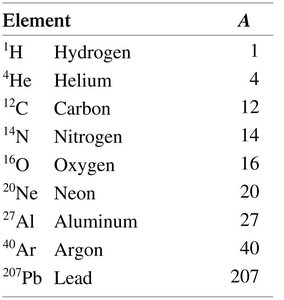
Atomic Mass and Atomic Mass Number
The mass of an atom is primarily determined by the sum of its protons and neutrons, known as the atomic mass number (A).
Atomic Mass Number (A):
Atomic Mass Unit (u):
Atomic Mass: The atomic mass (in u) is close to, but not exactly equal to, the atomic mass number.
Element | A |
|---|---|
Hydrogen | 1 |
Helium | 4 |
Carbon | 12 |
Nitrogen | 14 |
Oxygen | 16 |
Neon | 20 |
Aluminum | 27 |
Argon | 40 |
Lead | 207 |
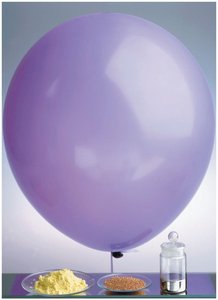
Moles and Molar Mass
A mole is a fundamental unit in chemistry and physics, representing Avogadro's number (\(N_A\)) of particles.
Avogadro's Number:
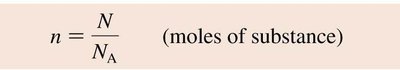
Number of Moles:
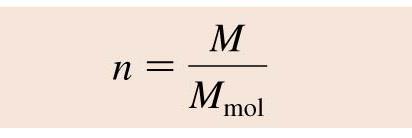
Molar Mass (Mmol): The mass of 1 mole of a substance, measured in kg/mol.
Number of Moles from Mass:
Pressure
Pressure is defined as the force exerted per unit area. It is a key state variable in describing gases.
Formula:
SI Unit: Pascal (Pa), where
Atmospheric Pressure: At sea level,
Temperature and Thermal Equilibrium
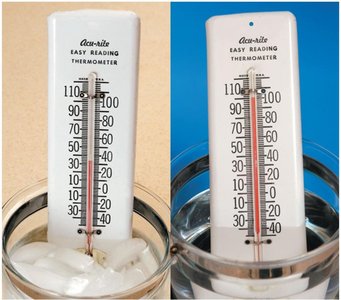
Temperature is a measure of the thermal energy in a system and is determined using thermometers based on thermal equilibrium.
Thermal Equilibrium: When two objects have the same temperature, they are in thermal equilibrium.
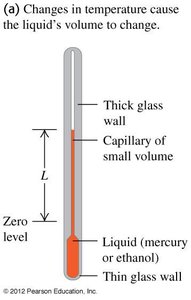
Measurement: Thermometers use the expansion of liquids (e.g., mercury or ethanol) to measure temperature.

Temperature Scales
There are three main temperature scales: Celsius, Kelvin, and Fahrenheit.
Celsius (°C): Defined by the freezing (0°C) and boiling (100°C) points of water.
Kelvin (K): Absolute scale, zero at absolute zero. Conversion:
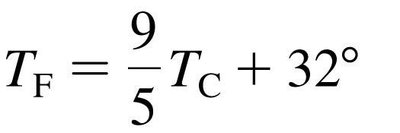
Fahrenheit (°F): Used in the US. Conversion:
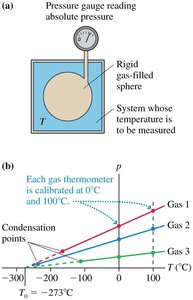
Absolute Zero and Gas Thermometers
Absolute zero is the lowest possible temperature, where all molecular motion ceases. Gas thermometers demonstrate the linear relationship between pressure and temperature.
Absolute Zero:
Gas Thermometers: Used to calibrate temperature scales based on pressure changes.
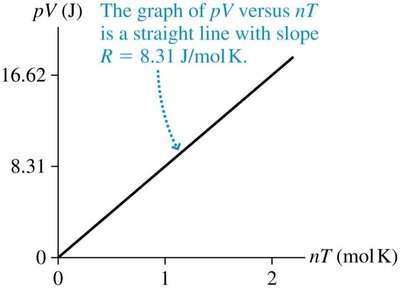
Ideal Gases and the Ideal-Gas Law
The ideal-gas model treats gas atoms as hard spheres that interact only through elastic collisions. The ideal-gas law relates pressure, volume, temperature, and number of moles.
Conditions: Valid for low density and high temperature (well above condensation point).
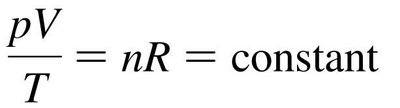
Ideal-Gas Law: where
Alternate Form: where
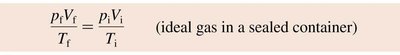
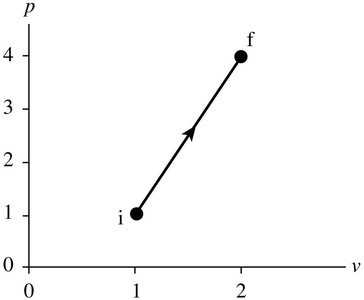
pV Diagrams and Gas Processes
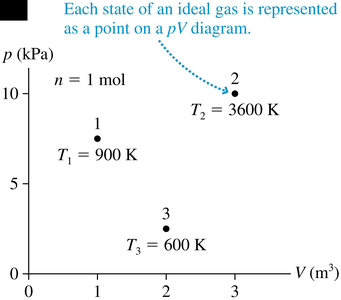
pV diagrams graphically represent the state and processes of an ideal gas. Each point corresponds to a unique combination of pressure and volume.
States: Each state is defined by (p, V, T, n).
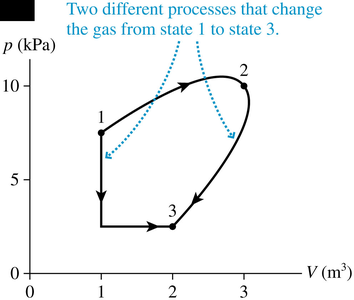
Processes: Paths on the diagram show how the gas transitions between states.
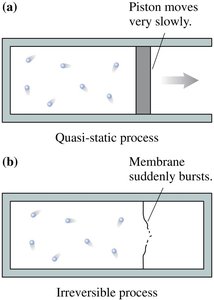
Quasi-static and Irreversible Processes
Gas processes can be quasi-static (slow and reversible) or irreversible (rapid and non-reversible).
Quasi-static: The system remains nearly in equilibrium throughout the process.
Irreversible: Rapid changes prevent the system from maintaining equilibrium.
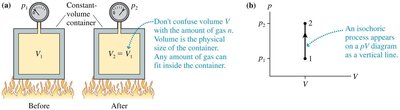
Types of Ideal-Gas Processes
Isochoric (Constant Volume): Volume remains fixed; pressure changes with temperature.
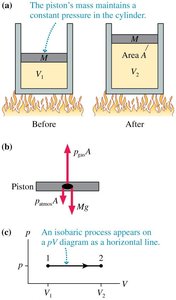
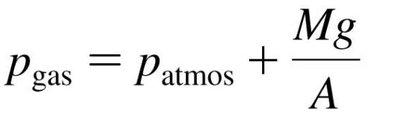
Isobaric (Constant Pressure): Pressure remains fixed; volume changes with temperature.
Isothermal (Constant Temperature): Temperature remains fixed; pressure and volume change inversely.
Adiabatic: No heat exchange; pressure, volume, and temperature change according to , where depends on the gas type.

Practice Problems and Applications
Sample problems illustrate the application of the ideal-gas law and pV diagrams to real-world scenarios, such as calculating final temperatures, pressures, and number of moles in various processes.
Summary Table: Types of Gas Processes
Process | Variable Held Constant | pV Diagram Shape |
|---|---|---|
Isochoric | Volume | Vertical line |
Isobaric | Pressure | Horizontal line |
Isothermal | Temperature | Hyperbola |
Adiabatic | No heat exchange | Steeper curve than isotherm |
Additional info: These notes expand on brief points from the original materials, providing definitions, formulas, and context for each concept. All included images directly reinforce the explanations and are referenced in the adjacent paragraphs.
