 Back
BackConcepts of Motion: Particles, Motion Diagrams, and Vectors
Study Guide - Smart Notes
 Tailored notes based on your materials, expanded with key definitions, examples, and context.
Concepts of Motion
Definition of a Particle
In physics, a particle is an object that can be represented as a mass at a single point in space. This simplification allows us to analyze motion without considering the object's size, shape, or internal structure.
Key Point: The particle model is useful for describing the motion of objects when their dimensions are negligible compared to the distances they travel.
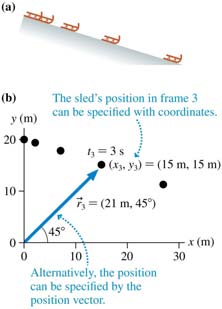
Example: A sled sliding down a hill can be modeled as a particle for motion analysis.
Position and Time
To describe motion, we need to specify where an object is (its position) and when it was at that position (its time). Position is measured using a coordinate system, and time is measured using a clock or stopwatch.
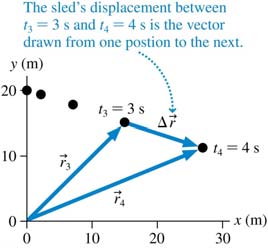
Key Point: The position of an object at a given time can be specified by coordinates (x, y) or by a position vector \( \vec{r} \).
Example: The sled's position at t3 = 3 s is (15 m, 15 m), and its position vector is \( \vec{r}_3 = (21\text{ m}, 45^\circ) \).
Displacement
Displacement is the change in position of an object, represented by a vector drawn from the initial position to the final position. It is given the symbol \( \Delta \vec{r} \).
Key Point: Displacement is a vector quantity, meaning it has both magnitude and direction.
Formula:
Example: The sled's displacement between t3 = 3 s and t4 = 4 s is shown as a vector connecting the two positions.
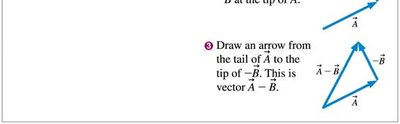
Vector Addition and Subtraction
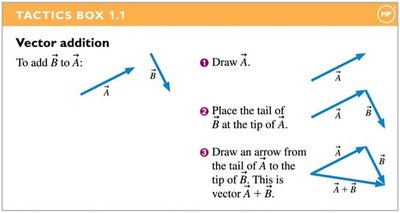
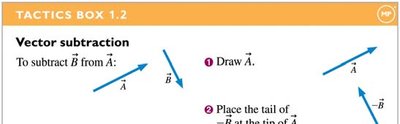
Vectors are added and subtracted using graphical methods. To add two vectors, place the tail of the second vector at the tip of the first and draw the resultant from the tail of the first to the tip of the second. To subtract, add the negative of the vector.
Key Point: Vector addition and subtraction are fundamental for analyzing motion in physics.
Formula for Addition:
Formula for Subtraction:
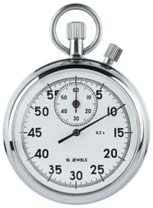
Time Interval
The time interval is the difference between the final and initial times during which an object moves. It is measured using a stopwatch or clock.
Key Point: Time interval is denoted as \( \Delta t \).
Formula:
Example: A stopwatch is used to measure the time interval for a runner.
Average Speed and Average Velocity
Average speed is the total distance traveled divided by the time interval, while average velocity is the displacement divided by the time interval. Average velocity is a vector and includes direction, whereas average speed is a scalar.
Formula for Average Speed:
Formula for Average Velocity:
Example: The runner with the highest average speed wins the race.

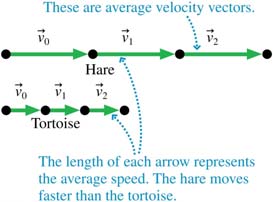
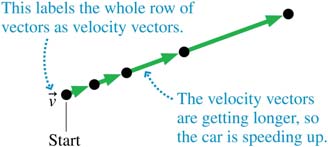
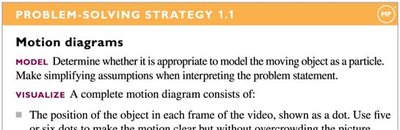
Motion Diagrams with Velocity Vectors
Motion diagrams can be enhanced by labeling the vectors connecting the dots as velocity vectors. The direction of the velocity vector matches the direction of displacement, and its length is proportional to the speed.
Key Point: Velocity vectors visually represent the speed and direction of motion at each interval.
Example: In a race between a tortoise and a hare, the hare's velocity vectors are longer, indicating greater speed.
Linear Acceleration
Acceleration describes how an object's velocity changes over time. It is the rate of change of velocity and is a vector quantity.
Formula for Average Acceleration:
Key Point: Acceleration can be positive (speeding up) or negative (slowing down).
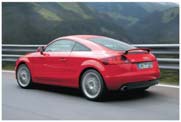
Example: A car accelerating from 0 to 60 mph in 6 seconds.
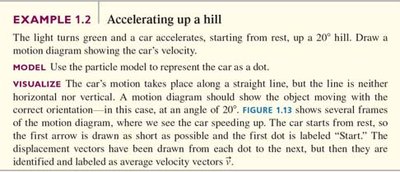
Example: Accelerating Up a Hill
This example illustrates how to draw a motion diagram for a car accelerating up a hill. The car's motion is represented as a series of dots, with velocity vectors increasing in length as the car speeds up.
Key Point: The motion diagram shows both displacement and velocity vectors, indicating acceleration.
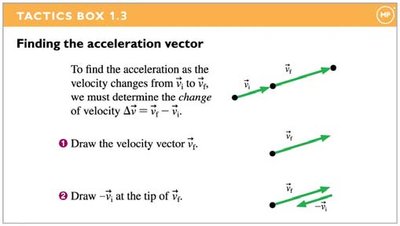
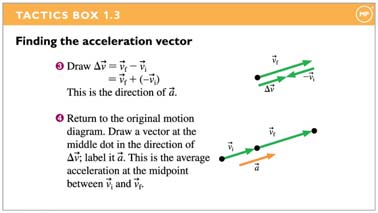
Finding the Acceleration Vector
To find the acceleration vector, determine the change in velocity between two points. Draw the velocity vectors, then draw the difference vector \( \Delta \vec{v} = \vec{v}_f - \vec{v}_i \). The acceleration vector is placed at the midpoint between the two velocity vectors.
Key Point: The acceleration vector is constructed from two velocity vectors and represents the average acceleration at the midpoint.
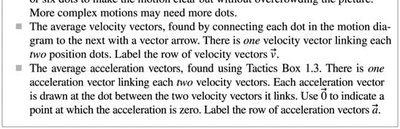
The Complete Motion Diagram
A complete motion diagram includes the position of the object at each frame, average velocity vectors connecting each pair of dots, and average acceleration vectors linking each pair of velocity vectors. This comprehensive representation allows for detailed analysis of motion.
Key Point: Use dots for positions, arrows for velocity, and additional arrows for acceleration.
Example: The diagram shows a car speeding up, with velocity vectors increasing in length and acceleration vectors indicating the change.
Summary Table: Components of a Motion Diagram
The following table summarizes the main components of a motion diagram:
Component | Description |
|---|---|
Position | Dot representing object's location at each frame |
Velocity Vector | Arrow connecting two position dots, labeled \( \vec{v} \) |
Acceleration Vector | Arrow linking two velocity vectors, labeled \( \vec{a} \) |
Additional info:
These notes expand on the brief points in the slides, providing definitions, formulas, and examples for each concept. The images included directly reinforce the explanations and are essential for visualizing the discussed physics principles.
