 Back
BackConservation of Energy and Energy Diagrams in Physics
Study Guide - Smart Notes
 Tailored notes based on your materials, expanded with key definitions, examples, and context.
Conservation of Energy
Law of Conservation of Energy
The law of conservation of energy states that the total energy of an isolated system remains constant; energy can neither be created nor destroyed, but can be transformed from one form to another. This principle is fundamental in analyzing physical systems and solving problems involving energy transformations.
Isolated System: A system with no energy exchange with its surroundings (no external work done).
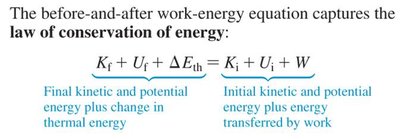
Work-Energy Equation: The before-and-after work-energy equation captures the law of conservation of energy:
K: Kinetic energy
U: Potential energy
\Delta E_{th}: Change in thermal energy
W: Work done by external forces
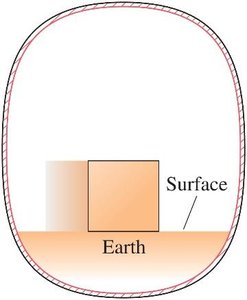
Choosing an Isolated System
When applying conservation of energy, it is crucial to define the system boundaries so that all relevant forces are internal. Examples include:
Object in Free Fall: System includes the object and Earth; gravitational force is internal.
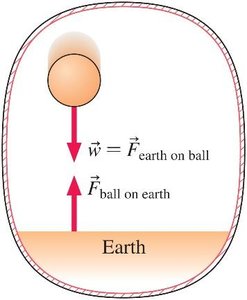
Object Sliding Down a Frictionless Ramp: System includes the object and Earth; normal force does no work.
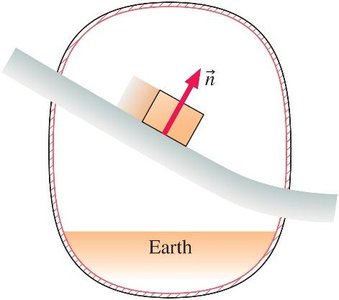
Object Compressing a Spring: System includes the object and the spring; spring force is internal.
Object Sliding with Friction: System includes the object and the surface; friction is internal.
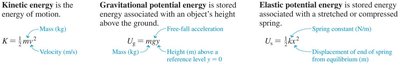
Forms of Energy
Kinetic Energy (K): The energy of motion.
Gravitational Potential Energy (U_g): Energy due to position in a gravitational field.
Elastic Potential Energy (U_s): Energy stored in a stretched or compressed spring.
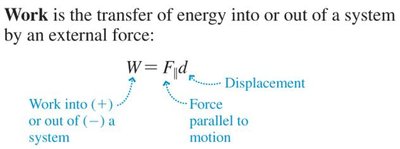
Work and Energy Transfer
Work is the transfer of energy into or out of a system by an external force:
F: Force parallel to motion
d: Displacement
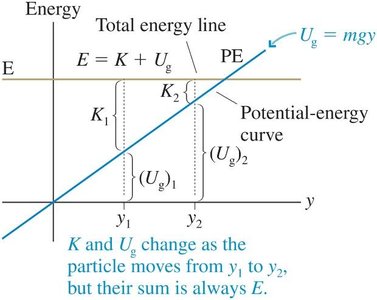
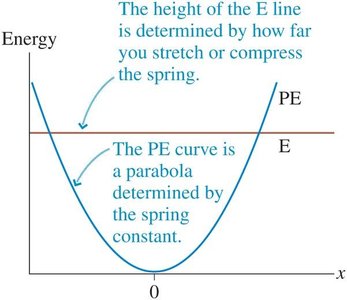
Energy Diagrams
Potential Energy as a Function of Position
Energy diagrams graph potential energy (PE) as a function of position. They are useful for visualizing how energy is distributed and transformed in a system.
Free Fall: Gravitational potential energy increases linearly with height.
Spring: Elastic potential energy forms a parabolic curve as a function of displacement.
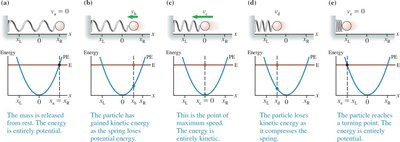
Mass Oscillating on a Spring
When a mass oscillates on a spring, energy transforms between kinetic and potential forms, but the total energy remains constant (if no non-conservative forces act).
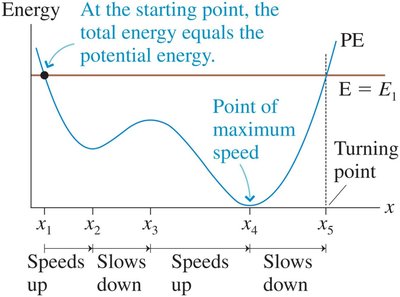
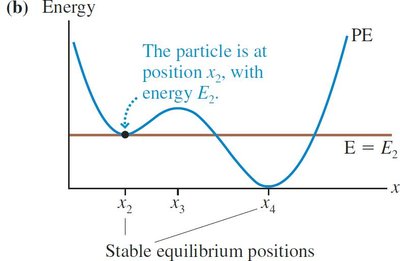
Interpreting Energy Diagrams
Energy diagrams help determine the motion of an object:
The vertical distance from the axis to the PE curve is the object's potential energy at that position.
The distance from the PE curve to the total energy line (E) is the kinetic energy.
The object cannot exist where the PE curve is above the E line (forbidden region).
Turning points occur where the E line crosses the PE curve; the object reverses direction here.
If there are two turning points, the object oscillates between them.
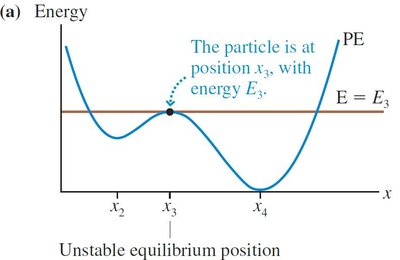
Equilibrium Positions
Equilibrium occurs where the potential energy curve has a local minimum or maximum:
Stable Equilibrium: Local minimum in PE; small displacements result in restoring forces.
Unstable Equilibrium: Local maximum in PE; small displacements lead to the object moving away from equilibrium.
At equilibrium, kinetic energy is zero and the object is at rest.
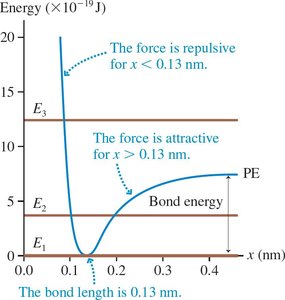
Molecular Bonds and Chemical Energy
Molecular Bonds
Molecular bonds are electrical interactions between electrons and nuclei, storing electric potential energy. The energy diagram for a molecular bond resembles that of a spring, with electrons oscillating between points where the PE curve intersects the total energy line. If the energy is raised above the PE curve, the bond breaks.
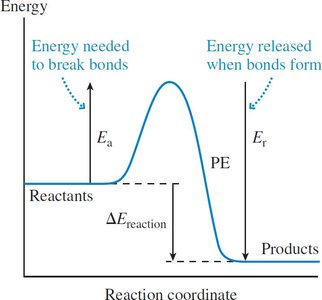
Chemical Reactions and Activation Energy
In chemical reactions, bonds are broken and formed. The reaction coordinate diagram shows the energy barrier (activation energy) that must be overcome for a reaction to proceed. The difference in energy between reactants and products is the energy released or absorbed in the reaction.
Activation Energy (E_a): Minimum energy required to initiate a reaction.
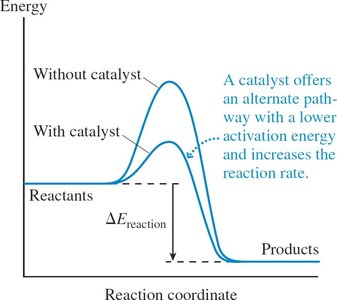
Catalysts: Lower the activation energy, increasing reaction rates.
Energy in Collisions
Types of Collisions
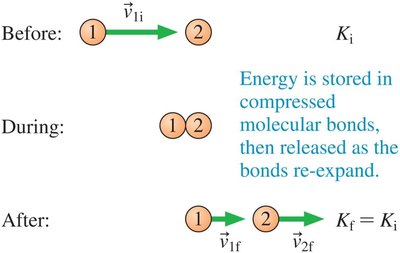
Perfectly Inelastic Collision: Objects stick together after collision; some mechanical energy is converted to thermal energy.
Perfectly Elastic Collision: Both momentum and mechanical energy are conserved; objects separate after collision.
Momentum Conservation: Holds for all collisions.
Momentum Conservation:
Energy Conservation (Elastic):
Power
Definition of Power
Power is the rate at which energy is transformed or transferred. The SI unit of power is the watt (W):
Output Power of a Force
The output power of a force is the rate at which the force does work:
F: Force
v: Velocity
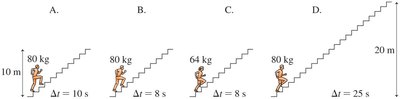
Examples of Power Calculation
Comparing the power output of students running up stairs or toy cars accelerating involves considering both the energy change and the time taken.
Summary Table: Key Energy Concepts
Concept | Equation | Description |
|---|---|---|
Kinetic Energy | Energy of motion | |
Gravitational Potential Energy | Energy due to height above ground | |
Elastic Potential Energy | Energy stored in a spring | |
Work | Energy transferred by a force | |
Power | Rate of energy transfer |
