 Back
BackElectric Potential, Equipotential Surfaces, and Capacitors: Study Notes
Study Guide - Smart Notes
 Tailored notes based on your materials, expanded with key definitions, examples, and context.
Electric Potential and Equipotential Surfaces
Introduction to Electric Potential
Electric potential is a fundamental concept in electricity and magnetism, describing the potential energy per unit charge at a point in space due to electric forces. It is a scalar quantity and is essential for understanding electric fields and energy transfer in electrical systems.
Electric Potential (V): The work done to move a unit positive charge from infinity to a point in space.
Unit: Volt (V), where 1 V = 1 Joule/Coulomb.
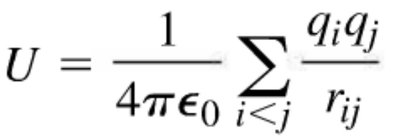
Relation to Energy: The electric potential energy (U) of a system of charges is given by the sum of the potential energies between pairs of charges.


The Electric Potential of a Point Charge
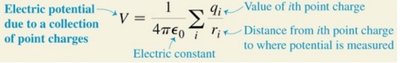
The electric potential at a distance r from a point charge q is given by:
Formula:
Electric constant: is the permittivity of free space.
Potential energy for multiple charges: $U = \frac{1}{4\pi\epsilon_0} \sum_{i

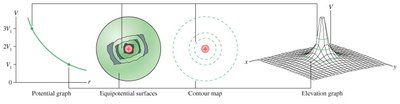
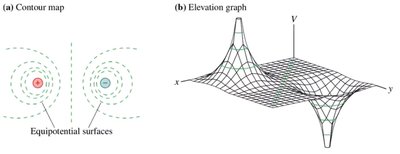
Visualizing the Potential of a Point Charge
Electric potential can be represented in various ways to aid understanding:
Potential graph: Shows how potential changes with distance.
Equipotential surfaces: Surfaces where the potential is constant.
Contour map: 2D representation of equipotential lines.
Elevation graph: 3D plot of potential as a function of position.

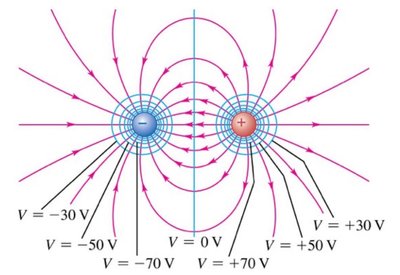
Electric Potential of Two Opposite Charges (Dipole)
For a dipole, the potential and equipotential surfaces are more complex, reflecting the influence of both positive and negative charges.
Equipotential lines: Surround both charges, showing regions of equal potential.
Elevation graph: Visualizes the potential landscape created by the dipole.
Rules for Equipotentials
Equipotential surfaces have specific properties that are important for understanding electric fields:
Equipotentials never intersect.
Surface of a static conductor: Is an equipotential surface; the entire conductor is at the same potential.
Field lines cross equipotential surfaces at right angles.
Close equipotentials: Indicate a strong electric field.
At large distances: Equipotential surfaces become spheres for systems with net charge.

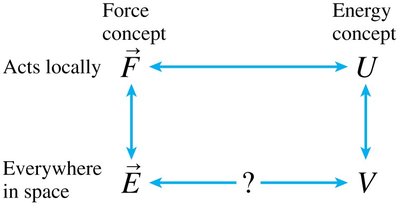
Finding the Electric Field from the Potential
Relationship Between Electric Field and Potential
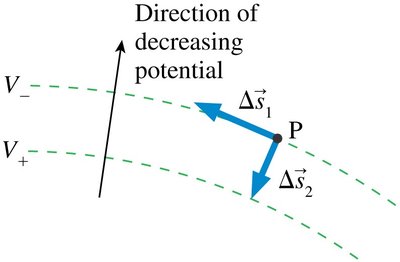
The electric field (E) is related to the spatial variation of the electric potential (V). The field points in the direction of decreasing potential.
Formula:
Component form: , ,
Physical meaning: The electric field is strongest where the potential changes most rapidly.

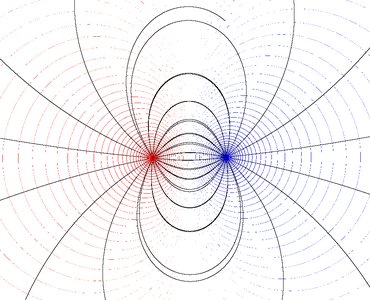
Geometry of Potential and Field
The geometry of equipotential surfaces and field lines illustrates the relationship between electric field and potential.
Field lines: Perpendicular to equipotential surfaces.
Direction: Field points from higher to lower potential.

Example: Finding E from the Slope of V
In regions where the electric field is parallel to an axis, the field can be found from the slope of the potential graph.
Graphical interpretation: The electric field is the negative slope of the potential vs. position graph.
Application: Useful for analyzing uniform fields, such as inside a parallel plate capacitor.

Finding the Potential from the Electric Field
Potential Difference from Electric Field
The potential difference between two points can be calculated by integrating the electric field along a path connecting them.
Formula:
Graphical interpretation: The area under the electric field vs. position graph gives the potential difference.

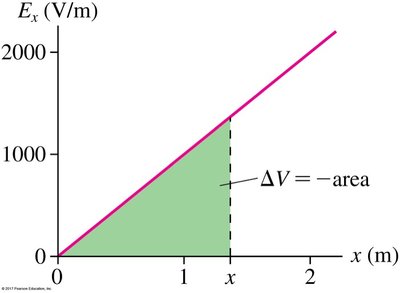
Example 26.1: Finding the Potential
This example demonstrates how to find the electric potential from a given electric field graph.
Given: as a function of .
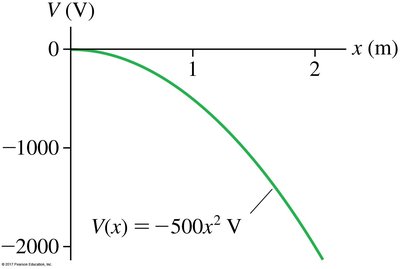
Solution: Integrate to find .
Result: V for the given field.


Electric Potential Inside a Parallel Plate Capacitor
Parallel Plate Capacitor
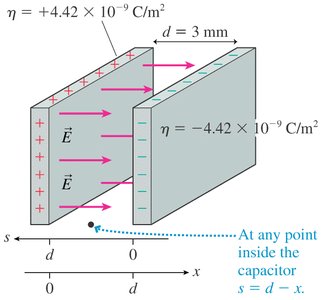
A parallel plate capacitor consists of two plates with equal and opposite charges, creating a uniform electric field between them. The potential varies linearly between the plates.
Surface charge density:
Potential difference:
At any point inside:

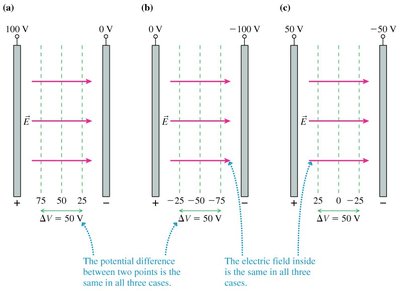
Choice of the V=0 Point
The reference point for zero potential can be chosen arbitrarily, as only potential differences matter in calculations.
Different choices: The potential difference between plates remains the same regardless of the reference point.

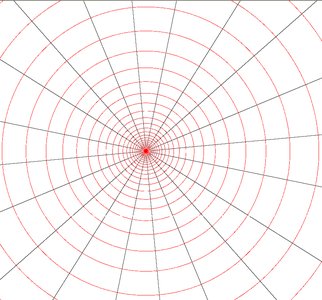
Field Lines and Contour Lines
Field lines and equipotential contour lines are used to represent the electric field and potential simultaneously. These are visual tools, not physical entities.
Field lines: Indicate direction and strength of the electric field.
Contour lines: Show regions of equal potential.

Graphical Representations of Electric Potential
Electric potential can be visualized using graphs, equipotential surfaces, contour maps, and elevation graphs, especially for parallel plate capacitors.
Potential graph: Linear decrease between plates.
Equipotential surfaces: Planes parallel to the plates.
Contour map: Lines of constant potential.
Elevation graph: 3D representation of potential.

Batteries and Capacitors
Batteries and Capacitors
Batteries are sources of constant potential difference, used to charge capacitors. The charge stored depends on the capacitance and the applied voltage.
Capacitance (C):
Unit: Farad (F), where 1 F = 1 Coulomb/Volt.
Charging: Connecting a capacitor to a battery causes the plates to become charged.

Example: A Proton in a Capacitor
This example illustrates the motion of a proton in a parallel plate capacitor, including calculations of electric field, charge, and the proton's trajectory.
Given: Plate diameter, separation, potential difference, initial speed.
Find: Electric field, charge on plates, whether the proton reaches the other side.

Summary Table: Key Formulas and Concepts
Concept | Formula | Description |
|---|---|---|
Electric Potential (Point Charge) | Potential at distance r from charge q | |
Electric Field (Point Charge) | Field at distance r from charge q | |
Potential Energy (Multiple Charges) | $U = \frac{1}{4\pi\epsilon_0} \sum_{i | Energy of a system of charges |
Capacitance (Parallel Plate) | Capacitance depends on plate area and separation | |
Potential Difference | Potential difference from electric field |
