 Back
Graphical Kinematics: Analyzing Position, Velocity, and Acceleration from Graphs
Study Guide - Smart Notes
 Tailored notes based on your materials, expanded with key definitions, examples, and context.
Q1. Given the displacement vs. time graph below, explain how to determine the velocity and acceleration at different time intervals.
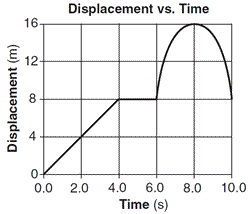
Background
Topic: Kinematics – Graphical Analysis
This question tests your understanding of how to interpret and analyze motion using displacement (position) vs. time graphs. You are expected to extract information about velocity and acceleration from the graph, which is a fundamental skill in calculus-based physics.
Key Terms and Formulas
Displacement (): The position of an object as a function of time.
Velocity (): The rate of change of displacement with respect to time. On a position vs. time graph, velocity is the slope of the curve.
Acceleration (): The rate of change of velocity with respect to time. On a velocity vs. time graph, acceleration is the slope; on a position vs. time graph, it is the curvature (second derivative).
Step-by-Step Guidance
Identify the different segments of the displacement vs. time graph (e.g., straight lines, flat regions, curves) and note the time intervals for each segment.
For each segment, determine the slope of the graph. The slope at any point gives the instantaneous velocity at that time. For straight-line segments, the velocity is constant; for curved segments, the velocity changes with time.
To find the acceleration, examine how the slope (velocity) changes over time. If the slope is constant, acceleration is zero. If the slope increases or decreases, calculate the rate of change of the slope (second derivative) to find acceleration.
For a flat segment (horizontal line), the slope is zero, indicating zero velocity. For a segment where the graph curves upward or downward, estimate the change in slope to infer acceleration (positive for upward curvature, negative for downward).
Set up the mathematical expressions for velocity and acceleration for at least one segment, using the definitions above. For example, if the segment is linear, use ; if it is curved, consider using calculus to find and .
Try solving on your own before revealing the answer!
Final Answer:
Segment 1 (0–4 s): The graph is a straight line with positive slope. The velocity is constant and can be calculated as . Acceleration is zero.
Segment 2 (4–6 s): The graph is flat (horizontal), so the velocity is zero and acceleration is also zero.
Segment 3 (6–10 s): The graph is a curve (parabolic shape). The velocity changes with time. At s (the peak), the slope is zero (velocity is zero). Before $t = 8$ s, the slope is positive (velocity is positive); after $t = 8$ s, the slope is negative (velocity is negative). The acceleration is negative (since the curve is concave down), and can be estimated by finding the second derivative or by calculating the change in velocity over the time interval.
This analysis shows how to extract velocity and acceleration information from a displacement vs. time graph by examining slopes and curvature.
