 Back
BackGuidance for 1-D Kinematics Graphical Methods: Calculating Displacement from Velocity-Time Graphs
Study Guide - Smart Notes
 Tailored notes based on your materials, expanded with key definitions, examples, and context.
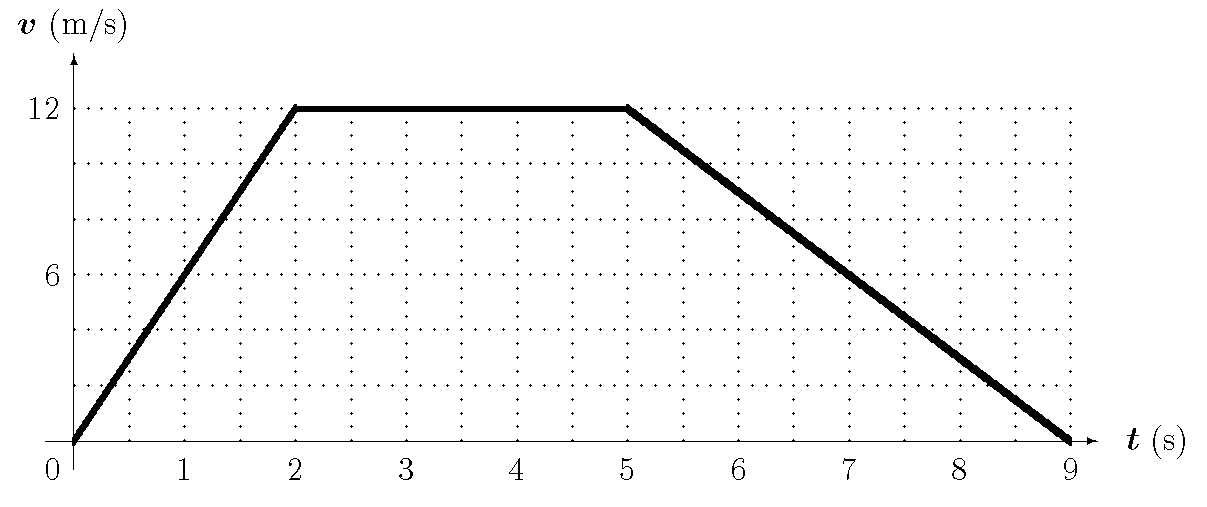
Q7.5: The graph represents the velocity-time plot of a straight-line motion of a car. How far does the car travel between and ?
Background
Topic: 1-D Kinematics – Graphical Methods
This question tests your ability to interpret a velocity-time graph and calculate the displacement (distance traveled) over a specific time interval. The area under the velocity-time curve between two points gives the displacement.
Key Terms and Formulas
Velocity (): The rate of change of position with respect to time.
Displacement (): The change in position, found by integrating (or summing) the area under the velocity-time graph.
Area under the curve: For straight-line segments, calculate the area of rectangles and triangles.
Key formula:
For piecewise linear graphs, sum the areas of geometric shapes (rectangles, triangles) between and .
Step-by-Step Guidance
Examine the velocity-time graph between and . Identify the shapes formed under the curve in this interval (rectangles and triangles).
Calculate the area under the curve for each segment. For example, from to , the velocity is constant, forming a rectangle. From $t = 5\ \text{s}$ to , the velocity decreases linearly, forming a triangle.
For the rectangle: Area = width × height. For the triangle: Area = × base × height.
Add the areas together to find the total displacement between and .
Try solving on your own before revealing the answer!
Final Answer: 48 m
The total displacement is the sum of the rectangle and triangle areas under the velocity-time curve.
