 Back
BackKinematics: Motion Along a Straight Line – Displacement, Velocity, and Graphical Analysis
Study Guide - Smart Notes
 Tailored notes based on your materials, expanded with key definitions, examples, and context.
Kinematics: The Study of Motion
Introduction to Kinematics
Kinematics is a branch of physics that describes the motion of objects without considering the causes of motion. It focuses on measurable quantities such as displacement, velocity, and acceleration. Understanding these concepts is essential for analyzing how objects move in a straight line, which forms the foundation for more advanced topics in mechanics.
Displacement is the change in position of an object along a straight line.
Velocity and acceleration are key quantities used to describe motion.
Real-world examples include a runner accelerating during a race and decelerating after crossing the finish line.

Displacement, Time, and Average Velocity
Defining Displacement and Average Velocity
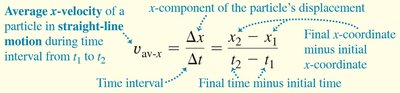
When a particle moves along the x-axis, its position is described by the coordinate x. The change in position, or displacement, is the difference between the final and initial coordinates. Average velocity quantifies how quickly displacement occurs over a time interval.
Displacement (\( \Delta x \)): The difference between the final and initial positions.
Average velocity (\( v_{\text{av}-x} \)): The displacement divided by the time interval.
The formula for average x-velocity is:
$ v_{\text{av}-x} = \frac{\Delta x}{\Delta t} = \frac{x_2 - x_1}{t_2 - t_1} $
Rules for the Sign of X-Velocity
The sign of the x-velocity indicates the direction of motion along the x-axis. Positive velocity means motion in the +x direction, while negative velocity means motion in the -x direction. The sign also depends on whether the x-coordinate is increasing or decreasing.
If x-coordinate is... | x-velocity is... | Explanation |
|---|---|---|
Positive and increasing | Positive | Moving in +x-direction |
Positive and decreasing | Negative | Moving in -x-direction |
Negative and increasing | Positive | Moving in +x-direction |
Negative and decreasing | Negative | Moving in -x-direction |
Average Velocity in Context
Application: Race and Average Velocity
In competitive sports, such as swimming or running, the winner is determined by who achieves the greatest magnitude of average velocity over a fixed displacement. This means the athlete who covers the set distance in the shortest time wins.
Example: In a 50-meter swimming race, the swimmer with the highest average velocity (shortest time to cover 50 m) wins.

Graphical Analysis of Motion
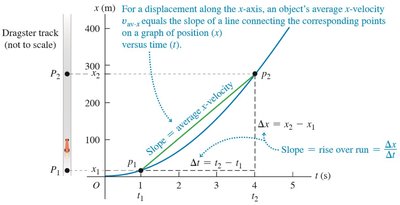
Position-Time Graphs and Average Velocity
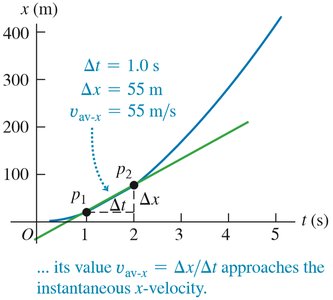
Position-time (x-t) graphs visually represent how an object's position changes over time. The slope of the line connecting two points on the graph gives the average velocity over that interval.
Slope of x-t graph: Represents average velocity between two points.
Formula: $ v_{\text{av}-x} = \frac{\Delta x}{\Delta t} $
Instantaneous Velocity
Definition and Calculation
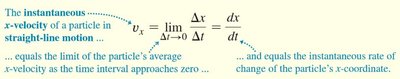
Instantaneous velocity is the velocity of an object at a specific instant or point along its path. It is mathematically defined as the derivative of position with respect to time, or the limit of average velocity as the time interval approaches zero.
$ v_x = \lim_{\Delta t \to 0} \frac{\Delta x}{\Delta t} = \frac{dx}{dt} $
Instantaneous velocity gives the rate of change of position at a precise moment.
It is generally not equal to the magnitude of average velocity over a finite interval.
Finding Velocity on an X-T Graph
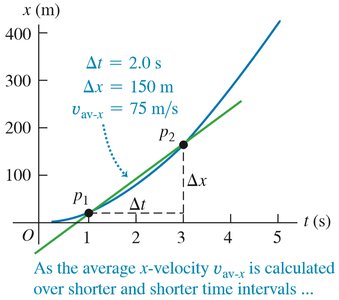
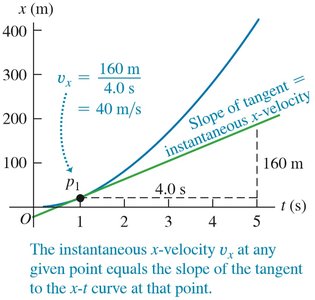
To determine velocity from a position-time graph, calculate the slope of the curve. As the time interval used to calculate average velocity becomes smaller, the value approaches the instantaneous velocity at a point.
For a finite interval, the slope gives average velocity.
As the interval shrinks, the slope approaches the tangent at a point, representing instantaneous velocity.
Interpreting X-T Graphs and Motion Diagrams
Analyzing Slope and Direction
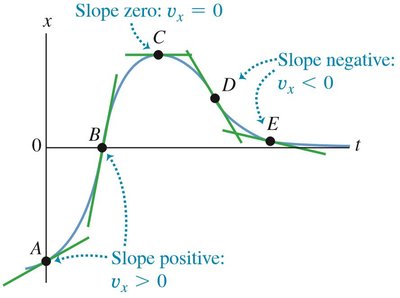
The slope of an x-t graph at any point indicates the direction and magnitude of velocity. Positive slope means positive velocity, negative slope means negative velocity, and zero slope means the object is momentarily at rest.
Positive slope: Object moves in +x direction.
Negative slope: Object moves in -x direction.
Zero slope: Object is at rest at that instant.
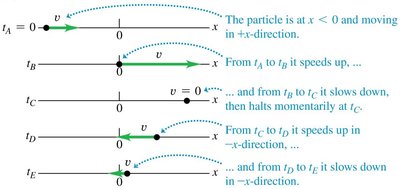
Motion Diagrams
Motion diagrams visually represent the position and velocity of a particle at different times. They help illustrate changes in speed and direction over time, corresponding to the features of the x-t graph.
Arrows indicate velocity direction and magnitude at various points.
Changes in arrow length and direction show acceleration and changes in motion.
Additional info: These foundational concepts in kinematics are essential for understanding more complex motion, including acceleration and two-dimensional motion, which are covered in subsequent chapters.
