 Back
BackKinematics, Vectors, and Motion – Step-by-Step Physics Study Guidance
Study Guide - Smart Notes
 Tailored notes based on your materials, expanded with key definitions, examples, and context.
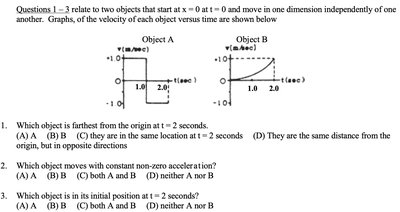
Q1. Which object is farthest from the origin at t = 2 seconds?
Background
Topic: Kinematics – Displacement from Velocity vs. Time Graphs
This question tests your ability to interpret velocity vs. time graphs and relate them to displacement, which is the area under the curve.
Key Terms and Formulas:
Displacement (): Area under the velocity vs. time graph.
Velocity (): Rate of change of position.
(for continuous functions)
Step-by-Step Guidance
Examine the velocity vs. time graphs for both objects. Note the direction (sign) and magnitude of velocity for each time interval.
Calculate the area under each curve from t = 0 to t = 2 s. For object A, consider positive and negative areas separately.
For object B, observe if the velocity is constant or changes direction, and calculate the area accordingly.
Compare the total displacement (area) for both objects to determine which is farther from the origin.
Try solving on your own before revealing the answer!
Final Answer: B
Object B is farther from the origin at t = 2 seconds because its velocity remains positive, so its displacement increases continuously.
Q2. Which object moves with constant non-zero acceleration?
Background
Topic: Acceleration from Velocity vs. Time Graphs
This question tests your understanding of how acceleration is represented on a velocity vs. time graph.
Key Terms and Formulas:
Acceleration (): Slope of the velocity vs. time graph.
Constant acceleration: Straight line with non-zero slope.
Step-by-Step Guidance
Look at the shape of each velocity vs. time graph. A straight line with a non-zero slope indicates constant acceleration.
For object A, check if the graph is a straight line or if it changes abruptly.
For object B, check if the graph is a straight line with a slope or a horizontal line.
Identify which object(s) have a velocity graph that matches the criteria for constant non-zero acceleration.
Try solving on your own before revealing the answer!
Final Answer: D
Neither A nor B moves with constant non-zero acceleration. Both graphs show either abrupt changes or constant velocity.
Q3. Which object is in its initial position at t = 2 seconds?
Background
Topic: Displacement and Area Under Velocity vs. Time Graphs
This question tests your ability to determine if an object returns to its starting position by analyzing the net area under the velocity vs. time graph.
Key Terms and Formulas:
Displacement (): Area under the velocity vs. time graph.
Initial position: x = 0 at t = 0.
Step-by-Step Guidance
Calculate the area under the velocity vs. time graph for each object from t = 0 to t = 2 s.
For object A, check if the positive and negative areas cancel each other out.
For object B, check if the area is zero or non-zero.
Determine which object has a net displacement of zero, indicating it is at its initial position.
Try solving on your own before revealing the answer!
Final Answer: A
Object A is at its initial position at t = 2 seconds because the positive and negative areas under its velocity graph cancel out.
Q13. Which pair of graphs shows the distance traveled versus time and the speed versus time for an object uniformly accelerated from rest?
Background
Topic: Kinematics – Uniform Acceleration
This question tests your understanding of how distance and speed change over time for an object starting from rest and accelerating uniformly.
Key Terms and Formulas:
Uniform acceleration: Constant acceleration.
Distance vs. time: For constant acceleration from rest, distance increases quadratically ().
Speed vs. time: For constant acceleration from rest, speed increases linearly ().
Step-by-Step Guidance
Review the shape of the distance vs. time graph for uniformly accelerated motion from rest. It should be a curve (parabola).
Review the shape of the speed vs. time graph. It should be a straight line starting from zero.
Compare each answer choice to these criteria.
Identify the pair that matches both the quadratic distance and linear speed relationships.
Try solving on your own before revealing the answer!
Final Answer: A
Choice (A) shows a curved distance vs. time graph and a straight-line speed vs. time graph, which matches uniform acceleration from rest.
Q70. A cart is initially moving at 0.5 m/s along a track. The cart comes to rest after traveling 1 m. The experiment is repeated on the same track, but now the cart is initially moving at 1 m/s. How far does the cart travel before coming to rest?
Background
Topic: Kinematics – Constant Acceleration and Energy
This question tests your understanding of how distance traveled depends on initial velocity when the cart comes to rest under the same conditions.
Key Terms and Formulas:
Initial velocity (): Starting speed of the cart.
Final velocity (): Zero, since the cart comes to rest.
Distance (): How far the cart travels before stopping.
Kinematic equation:
Step-by-Step Guidance
Write the kinematic equation for the cart coming to rest: .
Set and solve for in terms of and .
Compare the two scenarios: one with m/s and m, and the other with m/s.
Set up the ratio to find the new distance for the higher initial velocity.
Try solving on your own before revealing the answer!
Final Answer: D (4 m)
Doubling the initial velocity quadruples the stopping distance, since distance is proportional to the square of the initial velocity.
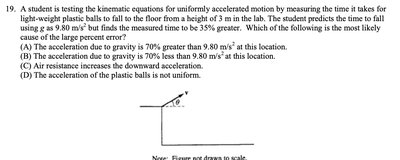
Q19. A student is testing the kinematic equations for uniformly accelerated motion by measuring the time it takes for light-weight plastic balls to fall from a height of 3 m in the lab. The student predicts the time to fall using a = 9.80 m/s2 but finds the measured time to be 35% greater. Which of the following is the most likely cause of the large percent error?
Background
Topic: Free Fall and Air Resistance
This question tests your understanding of factors affecting free fall, especially air resistance.
Key Terms and Formulas:
Acceleration due to gravity (): 9.80 m/s2 at Earth's surface.
Air resistance: Opposes motion, reduces effective acceleration.
Kinematic equation:
Step-by-Step Guidance
Consider why the measured time is longer than predicted. Think about forces acting on the ball besides gravity.
Recall that air resistance is more significant for light-weight objects.
Analyze how air resistance affects the acceleration and time of fall.
Eliminate answer choices that do not relate to air resistance or effective acceleration.
Try solving on your own before revealing the answer!
Final Answer: C
Air resistance increases the downward acceleration, causing the ball to fall more slowly and increasing the measured time.
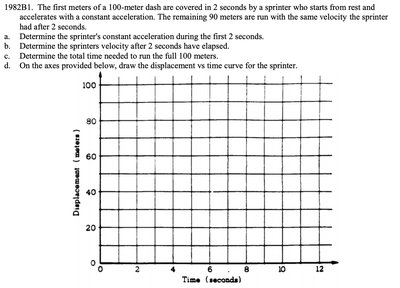
Q1982B1. The first meters of a 100-meter dash are covered in 2 seconds by a sprinter who starts from rest and accelerates with a constant acceleration. The remaining 90 meters are run with the same velocity the sprinter had after 2 seconds. Answer the following:
Background
Topic: Kinematics – Constant Acceleration and Uniform Motion
This question tests your ability to apply kinematic equations to solve for acceleration, velocity, and time, and to interpret displacement vs. time graphs.
Key Terms and Formulas:
Constant acceleration:
Initial velocity:
Displacement:
Kinematic equations:
(for constant velocity)
Step-by-Step Guidance
For the first 2 seconds, use the kinematic equation for displacement to solve for acceleration: .
Calculate the velocity after 2 seconds using .
For the remaining 90 meters, use the constant velocity equation to solve for the time needed.
Combine the times for both segments to find the total time for the dash.
Draw the displacement vs. time curve, showing the initial curve (acceleration) and then a straight line (constant velocity).
Try solving on your own before revealing the answer!
Final Answer:
a. m/s2 b. m/s c. Total time = 11 s d. The graph shows a curve for the first 2 seconds, then a straight line for the remaining time.
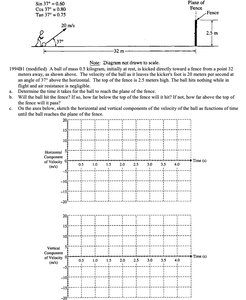
Q1994B1 (modified). A ball of mass 0.3 kg is kicked directly toward a fence from a point 32 meters away, as shown. The velocity of the ball as it leaves the kicker's foot is 20 meters per second at an angle of 37° above the horizontal. The top of the fence is 2.5 meters above the ground. The ball hits nothing while in flight.
Background
Topic: Projectile Motion
This question tests your ability to break down projectile motion into horizontal and vertical components, and to use kinematic equations to analyze the ball's trajectory.
Key Terms and Formulas:
Initial velocity (): 20 m/s at 37°
Horizontal component:
Vertical component:
Projectile equations:
Step-by-Step Guidance
Calculate the horizontal and vertical components of the initial velocity using trigonometric functions.
Set up the equations for horizontal and vertical motion.
Find the time it takes for the ball to reach the plane of the fence using the horizontal motion equation.
Use the vertical motion equation to determine the height of the ball when it reaches the fence.
Compare the height of the ball to the height of the fence to determine if it clears the fence.
Try solving on your own before revealing the answer!
Final Answer:
a. Time to reach the fence: 2 s b. Height at the fence: 7.5 m (clears the fence) c. Graphs show horizontal and vertical velocity components vs. time.
