Back
BackMotion Along a Straight Line: Kinematics and Dynamics
Study Guide - Smart Notes
 Tailored notes based on your materials, expanded with key definitions, examples, and context.
Motion Along a Straight Line
Introduction to Kinematics
Kinematics is the branch of physics that describes the motion of objects without considering the forces that cause the motion. In straight-line motion, velocity and acceleration are fundamental quantities used to characterize how an object's position changes over time.
Displacement: The change in position of a particle along a straight line.
Velocity: Describes how fast and in what direction the position changes.
Acceleration: Describes how fast the velocity changes.

Displacement, Time, and Average Velocity
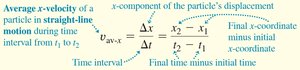
Displacement is the difference between the final and initial positions of a particle. Average velocity is the displacement divided by the time interval over which the displacement occurs.
Displacement formula:
Average velocity formula:
Units: meters (m) for displacement, seconds (s) for time, meters per second (m/s) for velocity.
Rules for the Sign of X-Velocity
The sign of velocity indicates direction. Positive velocity means motion in the positive x-direction; negative velocity means motion in the negative x-direction.
Average Velocity in Practice
In competitive sports, such as swimming, the winner is determined by who achieves the greatest average velocity over a set distance.
Example: A swimmer traverses 50 m in the shortest time, achieving the highest average velocity.

Position-Time Graphs
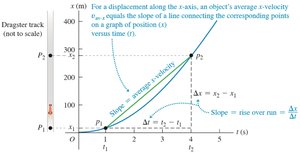
Position-time (x-t) graphs visually represent how an object's position changes over time. The slope of the graph at any point gives the velocity.
Slope of x-t graph:
Interpretation: Steeper slopes indicate higher velocities.
Instantaneous Velocity
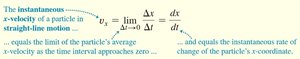
Instantaneous velocity is the velocity at a specific instant. It is defined as the limit of the average velocity as the time interval approaches zero.
Formula:
Difference from speed: Speed is the magnitude of velocity, but average speed is not necessarily the magnitude of average velocity.
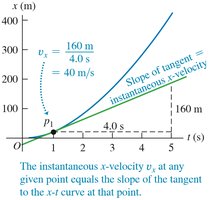
Finding Velocity on an X-T Graph
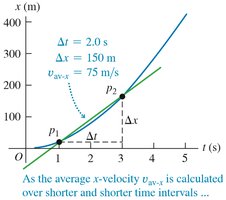
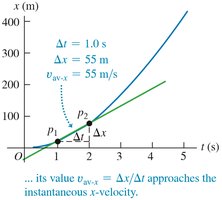
Velocity can be determined from the slope of the tangent to the x-t curve at a given point. As the time interval used to calculate average velocity becomes smaller, the value approaches the instantaneous velocity.
Example: Calculating average velocity over shorter intervals gives a better approximation of instantaneous velocity.
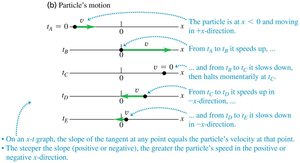
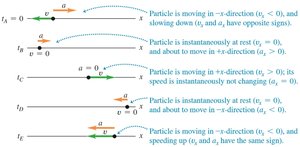
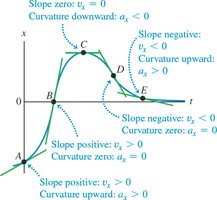
X-T Graphs and Motion Diagrams
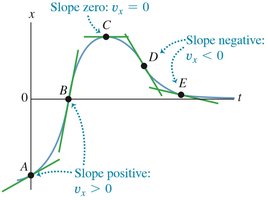
X-T graphs can show changes in velocity, including positive, negative, and zero values. Motion diagrams visually represent the particle's movement and velocity at different times.
Positive slope:
Negative slope:
Zero slope:
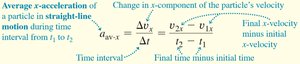
Average Acceleration
Acceleration is the rate of change of velocity with respect to time. Average acceleration is calculated over a finite time interval.
Formula:
Units: meters per second squared (m/s2).
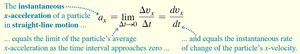
Instantaneous Acceleration
Instantaneous acceleration is the acceleration at a specific instant, defined as the limit of average acceleration as the time interval approaches zero.
Formula:
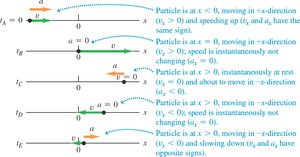
Rules for the Sign of X-Acceleration
The sign of acceleration indicates whether the velocity is increasing or decreasing and in which direction. Positive acceleration means velocity increases in the positive direction; negative acceleration means velocity increases in the negative direction or decreases in the positive direction.
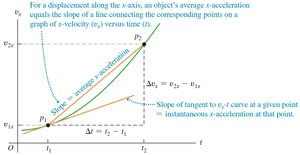
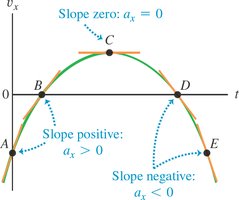
Finding Acceleration on a Vx-T Graph
Acceleration can be determined from the slope of the tangent to the vx-t curve at a given point. The slope of the line connecting two points gives the average acceleration.
Average acceleration: Slope of the line between two points.
Instantaneous acceleration: Slope of the tangent at a point.
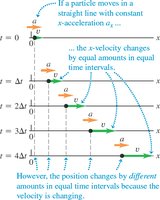
Motion with Constant Acceleration
When acceleration is constant, the velocity changes by equal amounts in equal time intervals, but the position changes by different amounts because velocity is changing.
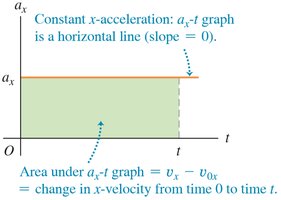
Constant acceleration:
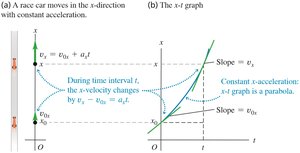
Position-time graph: Parabolic shape.
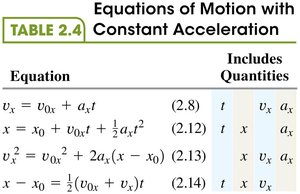
Equations of Motion with Constant Acceleration
Four key equations describe straight-line motion with constant acceleration. These equations relate position, velocity, acceleration, and time.
Equation | Includes Quantities |
|---|---|
t, , | |
t, x, | |
x, , | |
x, |
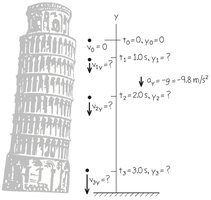
Freely Falling Objects
Free fall describes the motion of objects under the influence of gravity alone. The acceleration due to gravity is constant and directed downward.
Acceleration due to gravity: (downward)
Velocity changes: Equal increments in equal time intervals.
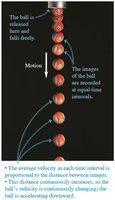
A Freely Falling Coin
If air resistance is negligible, all objects fall with the same constant acceleration due to gravity, regardless of their mass.
Example: Dropping a coin from a height; its acceleration is .
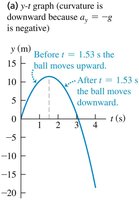
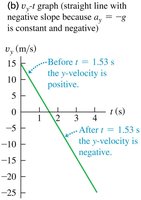
Up-And-Down Motion in Free Fall
When an object is thrown upward, it slows down until it reaches its highest point, then accelerates downward. The position and velocity as functions of time can be graphed.
At the highest point: Velocity is zero, but acceleration is still .
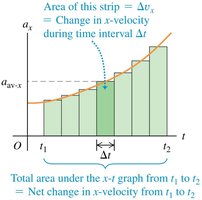
Velocity and Position by Integration
When acceleration is not constant, velocity and position can be determined by integrating acceleration over time. The area under the acceleration-time graph gives the change in velocity.
Integration:
Position: