 Back
Motion in One Dimension: Position, Velocity, and Acceleration
Study Guide - Smart Notes
 Tailored notes based on your materials, expanded with key definitions, examples, and context.
Motion in One Dimension
Position and Coordinate Systems
To describe the motion of an object, we must specify its position relative to a reference point, called the origin. A coordinate system consists of an origin and an axis marked in both positive and negative directions. The position of an object is given by a coordinate, which is a number indicating its location along the axis.
Reference Point (Origin): The zero point from which positions are measured.
Coordinate: Symbolized as x (or y for vertical motion), it represents the position along the axis.
Direction: Positive and negative values indicate direction relative to the origin.
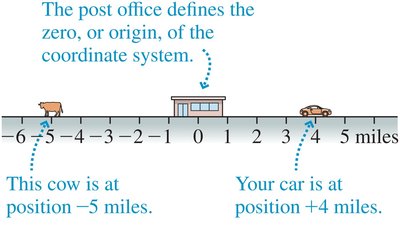
Example: If the post office is the origin, a cow at -5 miles and a car at +4 miles are positioned relative to it.
Time and Motion Diagrams
To fully describe motion, we must also specify the time at which an object is at a particular position. A motion diagram shows the position of an object at successive time intervals, with each frame labeled by its corresponding time t.
Time (t): Measured using a clock, it indicates when an object is at a certain position.
Motion Diagram: A sequence of images showing an object's position at equal time intervals.
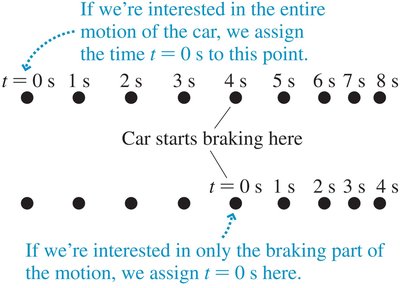
Example: The choice of t = 0 can depend on the part of the motion being analyzed, such as the start of braking.
Displacement and Change in Position
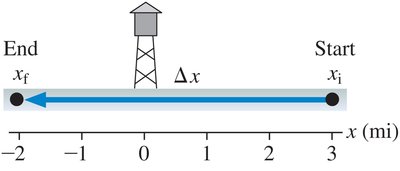
Displacement is the change in position of an object, defined as the difference between the final and initial positions:
Displacement (\(\Delta x\)): A vector quantity with both magnitude and direction.
Distance: The total length of the path traveled, regardless of direction (a scalar).
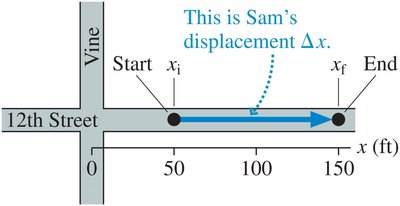
Example: If Sam walks from x_i = 0 ft to x_f = 150 ft, his displacement is 150 ft east.
Time Intervals
The time interval (\(\Delta t\)) is the difference between the final and initial times:
Time intervals are always positive.
They are used to measure how long a motion takes.
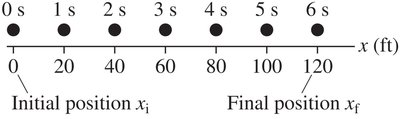
Worked Example: Displacement Calculation
Suppose Emily starts at 3 miles east of a water tower and ends at 2 miles west after half an hour. Her displacement is:
Representing Position: Axes and Directions
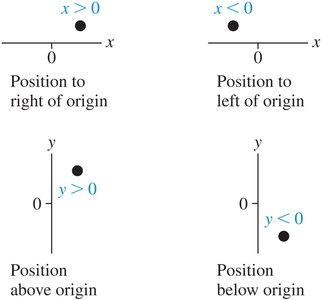
We use an x-axis for horizontal motion and a y-axis for vertical motion. The positive direction is typically to the right (x) or upward (y).
x > 0: Position to the right of the origin
x < 0: Position to the left of the origin
y > 0: Position above the origin
y < 0: Position below the origin
Describing and Graphing Motion
Position-Time Graphs
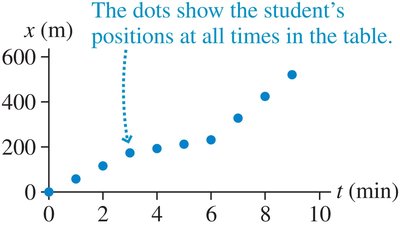
A position-versus-time graph plots an object's position on the vertical axis and time on the horizontal axis. Each point represents the object's position at a specific time.
The slope of the graph indicates how fast the position changes with time.
A straight line indicates constant velocity; a curved line indicates changing velocity.

From Position to Velocity
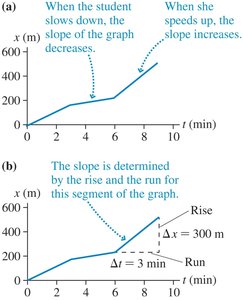
The velocity of an object is the rate of change of its position with respect to time. On a position-time graph, the velocity is the slope of the curve:
Steeper slope: Faster speed
Positive slope: Motion in the positive direction
Negative slope: Motion in the negative direction
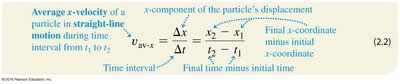
Worked Example: Calculating Average Velocity
The average velocity over a time interval is given by:
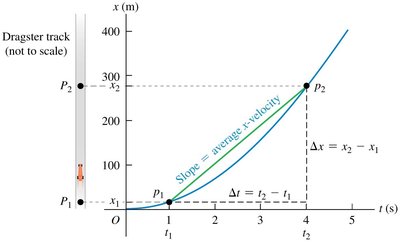
Velocity-Time Graphs
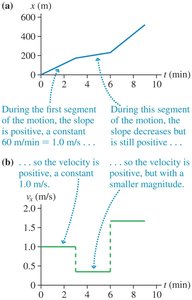
A velocity-versus-time graph shows how an object's velocity changes over time. The value at each point gives the velocity at that instant.
The area under the velocity-time graph gives the displacement.
The slope of the velocity-time graph gives the acceleration.
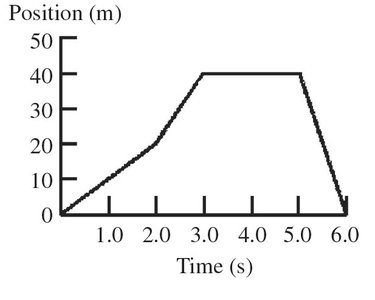
Example: Interpreting a Position-Time Graph
Given a position-time graph, the velocity at specific times can be found by calculating the slope at those points. For example:
At t = 1.0 s: 10 m/s
At t = 2.5 s: 20 m/s
At t = 4.0 s: 0 m/s
At t = 5.5 s: -40 m/s
From Velocity to Position
Given a velocity-time graph, the corresponding position-time graph can be constructed. The sign of the velocity indicates the direction of motion, and the magnitude indicates the steepness of the position graph.
Finding Displacement from a Velocity-Time Graph
The displacement over a time interval is equal to the area under the velocity-time graph between those times.
Uniform Motion
Definition and Representation
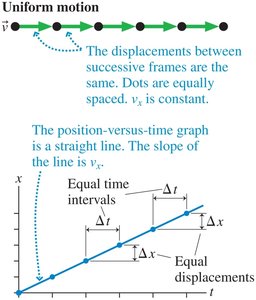
Uniform motion (or constant-velocity motion) occurs when an object moves in a straight line with equal displacements during equal time intervals. The position-time graph is a straight line, and the velocity is constant.
Uniform motion:
Equations of Uniform Motion
The basic equation for uniform motion is:
or, equivalently,
Worked Example: Average Speed and Velocity
Suppose you travel from the Bakery to the Cafe and then to the Art Gallery in 2.00 hours. The average speed and velocity are calculated as:
Average speed:
Average velocity:

Relative Motion Example
If Arthur and Betty start 100 m apart and walk toward each other at 3.0 m/s and 2.0 m/s, respectively, the time to meet is:
Instantaneous Velocity
Definition and Interpretation
Instantaneous velocity is the velocity of an object at a specific instant in time. It is the slope of the position-time graph at a single point.
For one-dimensional motion, a changing velocity means the object is speeding up or slowing down.
From now on, "velocity" refers to instantaneous velocity unless otherwise specified.
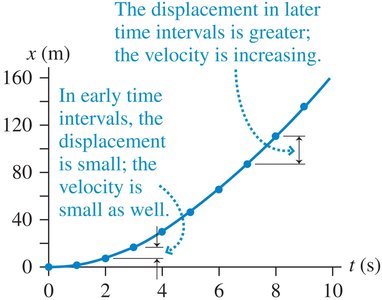
QuickCheck: Slope Interpretation
The slope at a point on a position-versus-time graph gives the object's velocity at that point.
Acceleration
Definition and Calculation
Acceleration is the rate of change of velocity with respect to time. It is given by:
Unit: m/s2
The slope of a velocity-time graph gives the acceleration.
Worked Example: Average Acceleration
A racquetball strikes a wall at 30 m/s and rebounds at 26 m/s in the opposite direction in 0.020 s. The average acceleration is:
Assuming the rebound direction is negative:
Motion with Constant Acceleration
Equations of Constant Acceleration
For straight-line motion with constant acceleration, the following equations apply:
Where:
= final position
= initial position
= final velocity
= initial velocity
= constant acceleration
= time interval
Worked Example: Braking to a Stop
If a car traveling at 15 m/s comes to rest in 1.5 s, the distance traveled while braking is:
Since ,
