 Back
Motion in One Dimension: Position, Velocity, and Acceleration
Study Guide - Smart Notes
 Tailored notes based on your materials, expanded with key definitions, examples, and context.
Motion in One Dimension
Representing Position
In one-dimensional motion, the position of an object is typically represented as a function of time, either through motion diagrams or position-versus-time graphs. These representations allow us to visualize and analyze how an object's location changes over time.
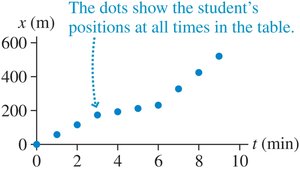
Motion Diagram: Each dot represents the object's position at a specific time interval.
Position Graph: The graph of x versus t shows the object's motion quantitatively.
Interpretation: The slope of the position graph indicates the velocity; a steeper slope means higher velocity.
Example: A student’s position at various times is shown as dots on a graph, illustrating how their displacement increases with time.

From Position to Velocity
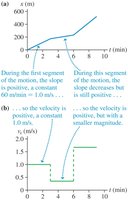
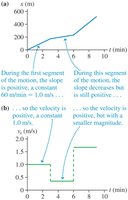
The velocity of an object can be deduced from the position-versus-time graph. The velocity-versus-time graph provides another perspective on the object's motion, showing how speed and direction change over time.
Velocity Graph: The slope of the position graph at any point gives the instantaneous velocity.
Constant Velocity: If the position graph is a straight line, the velocity is constant.
Changing Velocity: If the position graph is curved, the velocity changes with time.
Example: The velocity graph matches the segments of the position graph, with positive slopes indicating positive velocity.
From Velocity to Position
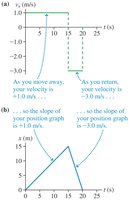
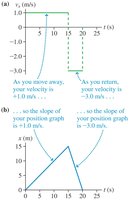
Conversely, the position-versus-time graph can be reconstructed from the velocity-versus-time graph. The sign and magnitude of velocity determine the slope and steepness of the position graph.
Positive Velocity: Upward slope in position graph.
Negative Velocity: Downward slope in position graph.
Magnitude: Steeper slope for higher velocity.
Example: A velocity graph with positive and negative values corresponds to a position graph with increasing and decreasing segments.
Uniform Motion
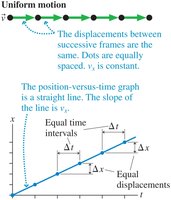
Uniform motion refers to straight-line motion where equal displacements occur during any successive equal-time intervals. The position-versus-time graph for uniform motion is a straight line, indicating constant velocity.
Definition: Uniform motion is also called constant-velocity motion.
Graphical Representation: Dots are equally spaced in the motion diagram; the position graph is linear.
Equation:
Example: Equal displacements in equal time intervals.
Equations of Uniform Motion
The velocity in uniform motion determines the change in position per unit time. Displacement is proportional to the time interval.
Equation:
Ratio Reasoning: If an object travels 12 km in 10 min, it will travel 60 km in 50 min (5 times the distance requires 5 times the time).
Example: Train problem solved using ratios.
Instantaneous Velocity
Instantaneous velocity is the speed and direction of an object at a specific instant. For changing velocity, the position graph is curved, but the slope at a point (tangent) gives the instantaneous velocity.
Definition: Instantaneous velocity is the derivative of position with respect to time.
Graphical Method: Slope of the tangent line to the position graph at a point.
Equation:
Example: Slope at t = 4.0 s gives the velocity at that instant.
Acceleration
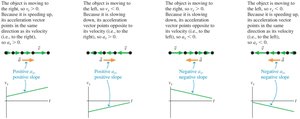
Acceleration describes how an object's velocity changes with time. It is the rate of change of velocity and is represented as the slope of the velocity-versus-time graph.
Definition:
Units: Meters per second squared (m/s2).
Significance: Positive acceleration means speeding up in the positive direction; negative acceleration can mean slowing down or speeding up in the negative direction.
Example: The sign of acceleration depends on both the direction of motion and whether the object is speeding up or slowing down.
Motion with Constant Acceleration
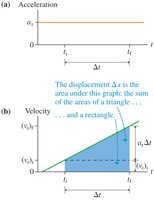
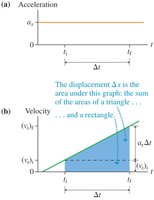
When acceleration is constant, the velocity changes linearly with time, and the position changes quadratically. The area under the velocity graph gives the displacement.
Velocity Equation:
Position Equation:
Displacement: Area under the velocity-time graph (rectangle + triangle).
Example: Rocket acceleration and displacement calculation.
Constant Acceleration Equations
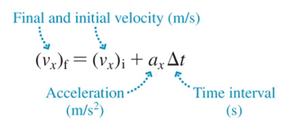
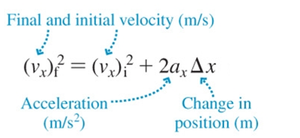
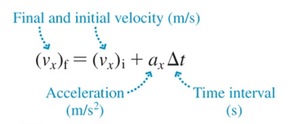
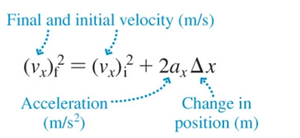
For motion with constant acceleration, several equations relate velocity, position, acceleration, and time. These are fundamental for solving kinematics problems.
Velocity:
Position:
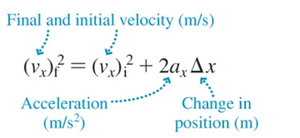
Velocity-Position:
Example: Car braking and runway length calculations.
Solving One-Dimensional Motion Problems
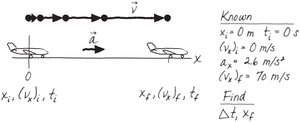
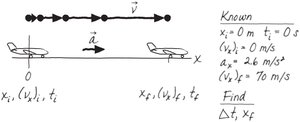
To solve kinematics problems, identify knowns and unknowns, select appropriate equations, and apply logical reasoning. Visual diagrams and graphs help clarify the situation.
Strategy: Use constant acceleration equations and ratio reasoning.
Example: Minimum runway length for a Boeing 747, using acceleration and velocity equations.
Free Fall
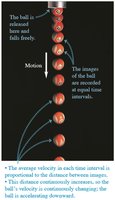
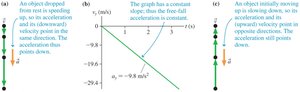
Free fall is the motion of an object under the influence of gravity alone. The acceleration due to gravity is constant and always points downward.
Definition: Free-fall acceleration is denoted by g, typically on Earth.
Equations: Kinematic equations apply, with for downward motion.
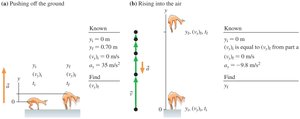
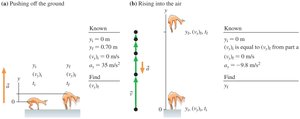
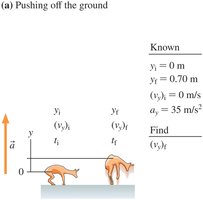
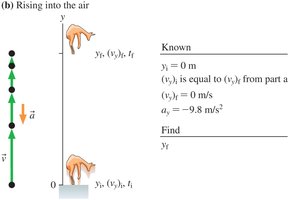
Example: Springbok leap problem, calculating takeoff speed and jump height using constant acceleration equations.

Summary Table: Constant Acceleration Equations
Equation | Variables | Application |
|---|---|---|
Initial velocity, acceleration, time | Find final velocity | |
Initial position, velocity, acceleration, time | Find position | |
Initial/final velocity, acceleration, displacement | Find velocity or displacement |
Additional info: These equations are valid for any one-dimensional motion with constant acceleration, including free fall and horizontal motion.
