 Back
BackPhysics 210: Units, Measurements, and Error – Study Guidance
Study Guide - Smart Notes
 Tailored notes based on your materials, expanded with key definitions, examples, and context.
Q1. Calculating Averages from Hand-Span Measurements
Background
Topic: Measurement and Data Analysis
This question tests your ability to calculate averages from a set of measurements and compare different measurement methods (hand-span vs. meter stick).
Key Terms and Formulas:
Average (Mean): The sum of all measurements divided by the number of measurements.
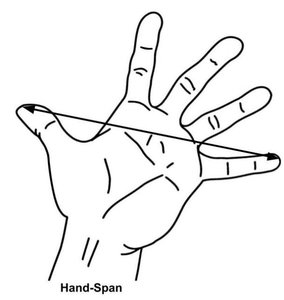
Hand-span: The distance from the tip of the thumb to the tip of the little finger when the hand is fully extended.
Step-by-Step Guidance
List all the hand-span measurements (in centimeters) for your group members from Table 1.
Add up all the hand-span measurements to get the total hand-span length.
Divide the total hand-span length by the number of group members to find the average hand-span length.
List all the hand-span measurements for the classroom object from Table 2.
Add up these measurements and divide by the number of group members to find the average length of the classroom object in hand-spans.
Try solving on your own before revealing the answer!
Q2. Comparing Hand-Span and Meter Stick Measurements
Background
Topic: Measurement Consistency and Relative Difference
This question asks you to compare two different measurement methods by calculating the relative percent difference between them.
Key Terms and Formulas:
LHS (Length in Hand-Spans): Product of average hand-span length and average classroom object length in hand-spans.
MSL (Meter Stick Length): Measurement of the classroom object using a meter stick (in centimeters).
Relative Percent Difference Formula:
Step-by-Step Guidance
Multiply the average hand-span length (from Q1) by the average classroom object length in hand-spans to get LHS.
Record the meter stick measurement (MSL) for the classroom object from Table 2.
Subtract MSL from LHS and take the absolute value of the result.
Add LHS and MSL, then divide by 2 to get the average of the two measurements.
Divide the absolute difference by the average, then multiply by 100 to get the relative percent difference.
Try solving on your own before revealing the answer!
Q3. Evaluating Consistency of Measurement Methods
Background
Topic: Experimental Error and Consistency
This question asks you to interpret the relative percent difference calculated in Q2 and decide if the two measurement methods are consistent.
Key Terms:
Consistency: How closely two measurement methods agree with each other.
Threshold: A relative percent difference less than 10% is generally considered reasonably consistent.
Step-by-Step Guidance
Review the relative percent difference you calculated in Q2.
Compare this value to the 10% threshold for consistency.
If the value is less than 10%, the methods are reasonably consistent; if greater, they are not.
Try solving on your own before revealing the answer!
Q4. Calculating Volume and Density of Cylinders and Prisms
Background
Topic: Volume and Density Calculations
This question tests your ability to use geometric formulas to calculate the volume of cylinders and rectangular prisms, and then use those volumes to find density.
Key Terms and Formulas:
Volume of a Cylinder:
= diameter
= height (or length)
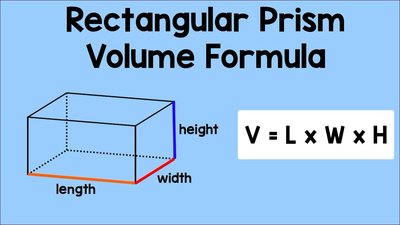
Volume of a Rectangular Prism:
= length
= width
= height
Density:
= mass (g)
= volume ()
Step-by-Step Guidance
For each cylinder, measure and record the diameter and height (length) in centimeters.
Calculate the volume of each cylinder using the formula above.
For each rectangular prism, measure and record the length, width, and height in centimeters.
Calculate the volume of each prism using the formula above.
For each object, divide the measured mass by the calculated volume to find the density in .
Try solving on your own before revealing the answer!
Q5. Identifying Materials Using Density and Percent Error
Background
Topic: Material Identification and Percent Error
This question asks you to compare your calculated densities to reference values and use percent error to estimate the material of each object.
Key Terms and Formulas:
Percent Error Formula:
Reference Densities:
Aluminum: 2.70
Brass: 8.40 – 8.73
Tungsten: 19.25
Polypropylene: 0.950
Nylon: 1.15
Polyvinyl Chloride: 1.39
Step-by-Step Guidance
For each object, compare your calculated density to the reference densities provided.
Calculate the percent error for each possible material using the formula above.
Identify the material with the lowest percent error (less than 15% is considered a good match).
If all percent errors are greater than 15%, conclude that the material is unknown.
Try solving on your own before revealing the answer!
