 Back
BackPhysics Study Guide: Sound and Scientific Data
Study Guide - Smart Notes
 Tailored notes based on your materials, expanded with key definitions, examples, and context.
Sound: Properties, Production, and Detection
Introduction to Sound
Sound is a form of energy produced by vibrating objects and travels as waves through various media. Understanding sound involves studying its production, transmission, and detection, as well as its applications in both nature and technology.
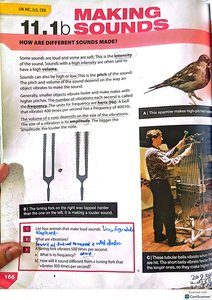
Making Sounds
Sound is generated when objects vibrate, causing the surrounding air particles to oscillate and transmit energy. The pitch and loudness of a sound depend on the frequency and amplitude of these vibrations.
Pitch: Determined by the frequency of vibration. Higher frequency produces higher pitch.
Loudness: Related to the amplitude of vibration. Greater amplitude results in louder sound.
Examples: Tuning forks, musical instruments, and animal vocalizations.
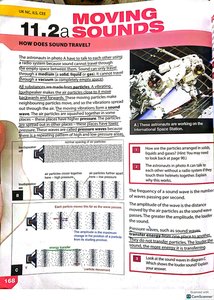
Moving Sounds: How Sound Travels
Sound travels as longitudinal waves, where particles oscillate parallel to the direction of wave propagation. The speed of sound depends on the medium (solid, liquid, or gas) and its properties.
Longitudinal Waves: Characterized by compressions and rarefactions in the medium.
Frequency ($f$): Number of wave cycles per second, measured in Hertz (Hz).
Wavelength ($\lambda$): Distance between successive compressions or rarefactions.
Wave Equation: $v = f \lambda$
Example: Sound waves traveling through air, water, or solids.
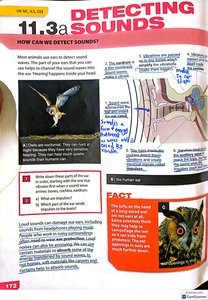
Detecting Sounds
Animals and humans detect sound using specialized organs such as ears. The ear converts sound waves into electrical signals that are interpreted by the brain.
Outer Ear: Collects sound waves and channels them to the eardrum.
Middle Ear: Amplifies vibrations using ossicles.
Inner Ear: Converts vibrations into nerve impulses via the cochlea.
Example: Owl's ears are adapted for precise sound localization.
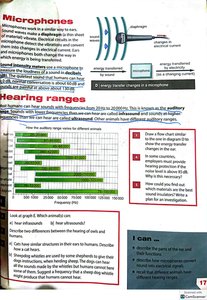
Microphones and Hearing Ranges
Microphones convert sound energy into electrical signals, enabling recording and amplification. Different animals have varying hearing ranges, allowing them to detect sounds at different frequencies.
Microphone Principle: Diaphragm vibrates in response to sound, generating electrical signals.
Hearing Range: Humans typically hear frequencies from 20 Hz to 20,000 Hz. Other animals, such as dogs and bats, can detect higher frequencies.
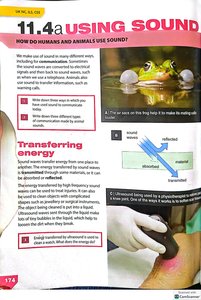
Using Sound: Applications and Energy Transfer
Sound is used for communication, navigation, and medical purposes. Energy transfer occurs when sound waves are reflected, absorbed, or transmitted through different materials.
Communication: Animals use sound to warn, attract mates, or locate prey.
Medical Applications: Ultrasound imaging uses high-frequency sound waves to visualize internal body structures.
Energy Transfer: Sound waves can be reflected (echoes), absorbed, or transmitted.
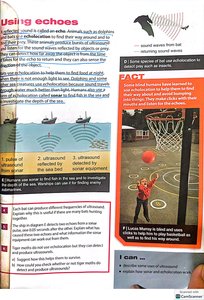
Using Echoes
Echoes are reflected sound waves used by animals (e.g., bats, dolphins) for echolocation and by humans in sonar technology. Echoes help determine the location and distance of objects.
Echolocation: Animals emit sounds and interpret the returning echoes to navigate and hunt.
Sonar: Technology that uses sound waves to detect objects underwater.
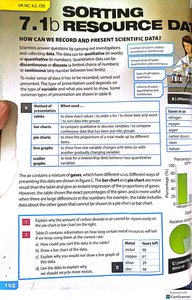
Recording and Presenting Scientific Data
Types of Scientific Data
Scientific investigations produce qualitative and quantitative data. Proper recording and presentation of data are essential for analysis and interpretation.
Qualitative Data: Descriptive information (e.g., color, texture).
Quantitative Data: Numerical measurements (e.g., mass, volume).
Data Presentation Methods
Data can be presented using tables, charts, and graphs to facilitate comparison and visualization.
Tables: Organize data for easy reference.
Bar Charts: Compare quantities across categories.
Scatter Graphs: Show relationships between variables.
Pie Charts: Display proportions of a whole.
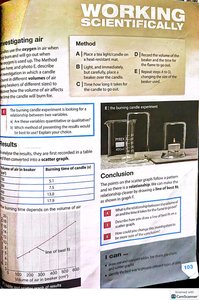
Scientific Method Example: Investigating Air
Experiments often involve measuring variables and analyzing results using graphs. For example, investigating how the volume of air affects the time a candle burns.
Method: Measure time for different air volumes.
Results: Present data in a table and scatter graph.
Conclusion: Identify patterns and relationships.
Additional info:
Some content inferred and expanded for academic completeness, especially regarding sound wave properties, ear anatomy, and scientific data presentation.
