 Back
Physics with Calculus: 1D Motion & Relative Motion – Graph Interpretation and Kinematics.
Study Guide - Smart Notes
 Tailored notes based on your materials, expanded with key definitions, examples, and context.
Q2.2: Interpreting a Velocity-Time Graph for 1D Motion
Background
Topic: Kinematics – Graphical Analysis
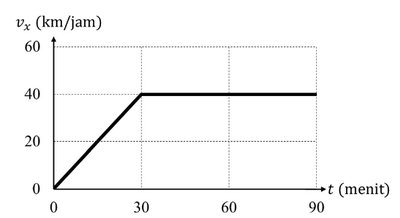
This question tests your ability to interpret velocity-time graphs, identify intervals of constant velocity, calculate displacement from a graph, and sketch position-time graphs based on velocity data.
Key Terms and Formulas:
Constant velocity: When the velocity remains unchanged over a time interval (the graph is a horizontal line).
Displacement from velocity-time graph: The area under the curve between two times gives the displacement.
Position-time graph: The slope at any point gives the velocity; a straight line means constant velocity, a curve means changing velocity.
Unit conversions: 1 hour = 60 minutes; ensure time units are consistent when calculating area/displacement.
Step-by-Step Guidance
Examine the graph and identify the time intervals where the velocity is constant (look for flat, horizontal segments).
To find the distance traveled from minute 30 to minute 60, calculate the area under the velocity-time graph between these times. Remember to convert minutes to hours if the velocity is in km/h.
For the position-time graph, start at x = 0 at t = 0. Sketch a curve for the accelerating phase (0–30 min), then a straight line for the constant velocity phase (30–90 min). Mark key points where the slope changes.
Try solving on your own before revealing the answer!
Final Answer:
1. The car moves at constant velocity from t = 30 min to t = 90 min (the flat part of the graph).
2. The distance traveled from minute 30 to minute 60 is 20 km. (Area = 40 km/h × 0.5 h = 20 km.)
3. The position-time graph starts as a curve (0–30 min, accelerating), then becomes a straight line (constant velocity) from 30–90 min. At 30 min, the car has traveled 10 km; at 60 min, 30 km; at 90 min, 50 km.
Q2.3: Analyzing a Velocity-Time Graph for a Particle in 1D Motion
Background
Topic: Kinematics – Velocity, Acceleration, and Position Functions
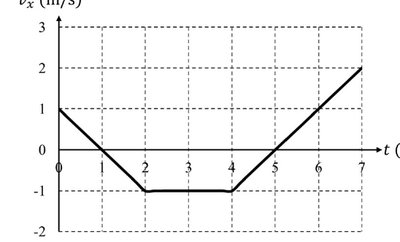
This question asks you to extract velocity, sketch acceleration, and write the position function from a velocity-time graph for a particle moving along the x-axis.
Key Terms and Formulas:
Velocity (): The rate of change of position with respect to time.
Acceleration (): The rate of change of velocity with respect to time; the slope of the velocity-time graph.
Position (): Can be found by integrating the velocity function over time.
Piecewise functions: When the graph changes slope, the function may need to be written in segments.
Step-by-Step Guidance
Read the velocity at s directly from the graph (find the value on the y-axis at ).
To sketch the acceleration-time graph, determine the slope of each segment of the velocity-time graph. Constant slope means constant acceleration.
Write the position function for each time interval by integrating the velocity function. Use as the initial condition.
Try solving on your own before revealing the answer!
Final Answer:
1. m/s
2. Acceleration is m/s² from 0–2 s, $0+1$ m/s² from 4–7 s.
3. for s; for s; for s.
Q2.5: Relative Motion – Ball and Lift Problem
Background
Topic: 1D Kinematics and Relative Motion
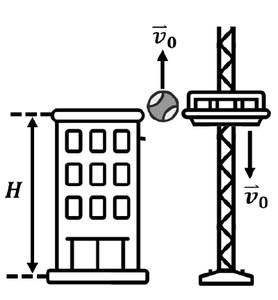
This question involves analyzing the motion of a ball thrown upward and a lift moving downward, both starting from the same height but with different initial velocities. You are asked to write position functions, find relative velocity, and determine when and where they meet.
Key Terms and Formulas:
Position function for constant acceleration:
Relative velocity:
Meeting point: Set and solve for .
Acceleration due to gravity: (downward, m/s²)
Step-by-Step Guidance
Write the position function for the ball: initial position , initial velocity , acceleration .
Write the position function for the lift: initial position , initial velocity , acceleration $0$ (since it moves at constant speed).
Find the initial relative velocity by subtracting the lift's velocity from the ball's velocity.
Set the two position functions equal to each other to find the time when they meet. Substitute this time back into either position function to find the height.
Try solving on your own before revealing the answer!
Final Answer:
1. ,
2. Initial relative velocity is $10$ m/s upward.
3. They meet at s, at m above the ground.
