Back
Physics with Calculus Exam I Study Guidance
Study Guide - Smart Notes
 Tailored notes based on your materials, expanded with key definitions, examples, and context.
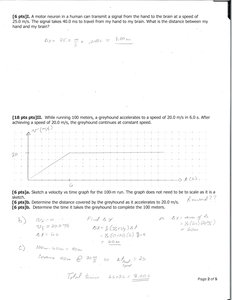
Q1. A motor neuron in a human can transmit a signal from the hand to the brain at a speed of 25.0 m/s. The signal takes 40.0 ms to travel from my hand to my brain. What is the distance between my hand and my brain?
Background
Topic: Kinematics (Uniform Motion)
This question tests your understanding of the relationship between speed, time, and distance for objects moving at constant velocity.
Key formula:
= distance (meters)
= speed (meters/second)
= time (seconds)
Step-by-Step Guidance
Identify the known values: m/s, ms.
Convert the time from milliseconds to seconds: ms s.
Set up the formula for distance: .
Plug in the values for and to find .
Try solving on your own before revealing the answer!
Final Answer: 1.00 m
The distance between the hand and the brain is 1.00 meter.
Q2. While running 100 meters, a greyhound accelerates to a speed of 20.0 m/s in 6.0 s. After achieving a speed of 20.0 m/s, the greyhound continues at constant speed.
Background
Topic: Kinematics (Acceleration and Constant Velocity)
This question tests your ability to analyze motion with two phases: acceleration and constant velocity, using kinematic equations.
Key formulas:
(for constant velocity)
= initial velocity (m/s)
= acceleration (m/s^2)
= time (s)
= distance (m)
Step-by-Step Guidance
For the acceleration phase, note that m/s, m/s, s.
Calculate the acceleration: .
Find the distance covered during acceleration using .
Subtract from the total distance (100 m) to find the distance covered at constant speed: .
Set up the formula for time at constant speed: .
Try solving on your own before revealing the answer!
Final Answer: Acceleration phase distance = 60 m, time at constant speed = 2 s, total time = 8 s
Acceleration:
Distance during acceleration:
Distance at constant speed:
Time at constant speed:
Total time:
Q3. The figure to the right shows a position-versus-time graph for a moving object. At which lettered point or points:
Is the object moving the slowest without being at rest?
Is the object moving the fastest?
Is the object at rest?
Does the object have a constant non-zero velocity?
Is the object moving to the right?
Background
Topic: Kinematics (Position vs. Time Graphs)
This question tests your ability to interpret position-time graphs and relate their slopes to velocity and motion characteristics.
Key concepts:
The slope of a position-time graph represents velocity.
Zero slope means the object is at rest.
Steeper slope means faster motion.
Positive slope means motion to the right; negative slope means motion to the left.
Step-by-Step Guidance
Examine each segment of the graph and identify the slope at each lettered point.
Determine which points have zero, positive, or negative slopes.
Compare the steepness of the slopes to identify fastest and slowest motion.
Identify segments with constant non-zero slope for constant velocity.
Try solving on your own before revealing the answer!
Final Answer:
Slowest (not at rest): Point C
Fastest: Point B
At rest: Point D
Constant non-zero velocity: Segment AB
Moving to the right: Segment AB
These answers are based on the slopes and directions shown in the position-time graph.
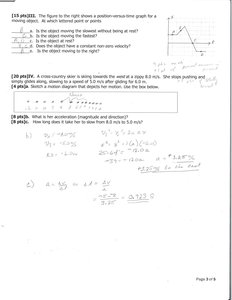
Q4. A cross-country skier is skiing towards the west at a zippy 8.0 m/s. She stops pushing and simply glides along, slowing to a speed of 5.0 m/s after gliding for 6.0 m.
Sketch a motion diagram that depicts her motion.
What is her acceleration (magnitude and direction)?
How long does it take her to slow from 8.0 m/s to 5.0 m/s?
Background
Topic: Kinematics (Deceleration, Motion Diagrams)
This question tests your ability to analyze deceleration, calculate acceleration, and determine time using kinematic equations.
Key formulas:
= initial velocity (m/s)
= final velocity (m/s)
= acceleration (m/s^2)
= displacement (m)
= time (s)
Step-by-Step Guidance
Identify the known values: m/s, m/s, m.
Use the kinematic equation to solve for .
Set up the formula for time: , rearrange to solve for .
Plug in the values for , , and to find .
Try solving on your own before revealing the answer!
Final Answer: Acceleration = -3.25 m/s² (east), Time = 0.923 s
Using :
(east)
Time:
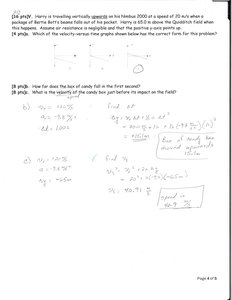
Q5. Harry is travelling vertically upwards on his Nimbus 2000 at a speed of 20 m/s when a package of Bertie Bott's beans falls out of his pocket. Harry is 65.0 m above the Quidditch field when this happens. Assume air resistance is negligible and that the positive y-axis points up.
Which of the velocity-versus-time graphs shown below has the correct form for this problem?
How far does the box of candy fall in the first second?
What is the velocity of the candy box just before its impact on the field?
Background
Topic: Kinematics (Projectile Motion, Free Fall)
This question tests your understanding of vertical motion under gravity, including initial upward velocity and displacement calculations.
Key formulas:
= initial velocity (m/s)
= acceleration due to gravity ( m/s²)
= time (s)
= displacement (m)
= final velocity (m/s)
Step-by-Step Guidance
For the graph, consider the initial upward velocity and negative acceleration due to gravity.
To find the distance fallen in the first second, use with s.
For the velocity just before impact, use with m.
Set up the equations and plug in the values for each part.
Try solving on your own before revealing the answer!
Final Answer:
Correct velocity-time graph: Option b
Distance fallen in first second: 15.1 m (upwards)
Velocity just before impact: 40.9 m/s (downwards)
The box initially moves upward, then falls down, accelerating due to gravity.
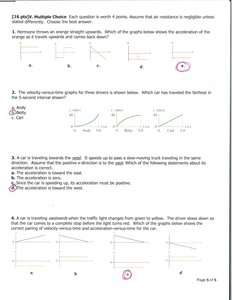
Q6. Multiple Choice: Each question is worth 4 points. Assume that air resistance is negligible unless stated differently. Choose the best answer.
Hermione throws an orange straight upwards. Which of the graphs below shows the acceleration of the orange as it travels upwards and comes back down?
The velocity-versus-time graphs for three drivers is shown below. Which car has traveled the farthest in the 5-second interval shown?
A car is traveling towards the west. It speeds up to pass a slow-moving truck traveling in the same direction. Assume that the positive x-direction is to the east. Which of the following statements about its acceleration is correct?
A car is traveling eastwards when the traffic light changes from green to yellow. The driver slows down so that the car comes to a complete stop before the light turns red. Which of the graphs below shows the correct pairing of velocity-versus-time and acceleration-versus-time for the car?
Background
Topic: Kinematics (Multiple Choice Concepts)
These questions test your understanding of acceleration, velocity, and direction in various scenarios.
Key concepts:
Acceleration due to gravity is constant and negative (downwards).
Area under velocity-time graph gives displacement.
Acceleration direction depends on velocity and whether the object is speeding up or slowing down.
Step-by-Step Guidance
For each question, analyze the scenario and match it to the correct graph or statement.
For the velocity-time graph, compare the areas under each curve to determine which car traveled the farthest.
For acceleration direction, consider the reference direction and whether the object is speeding up or slowing down.
For the eastward car slowing down, match the velocity and acceleration graphs accordingly.
Try solving on your own before revealing the answer!
Final Answers:
1. Correct acceleration graph: Option C
2. Car that traveled farthest: Carl
3. Acceleration direction: Toward the west (Option D)
4. Correct velocity and acceleration graph: Option D
These answers are based on the physical principles and graphical analysis for each scenario.