 Back
Physics with Calculus: Motion, Free Fall, and Graphs Study Guide
Study Guide - Smart Notes
 Tailored notes based on your materials, expanded with key definitions, examples, and context.
Q1. What are the aforementioned free help sessions for?
Background
Topic: Course Support and Office Hours
This question is about understanding the purpose of free help sessions (office hours) in a college physics course. These sessions are designed to provide students with additional support outside of regular class time.
Key Terms:
Office Hours: Scheduled times when instructors or teaching assistants are available to help students.
Peer Support: Opportunities to learn from fellow students.
Step-by-Step Guidance
Consider the typical goals of office hours in a physics course: answering questions, clarifying concepts, and providing guidance on assignments or exam preparation.
Think about who can attend these sessions and what kinds of questions or topics are appropriate to bring up.
Reflect on how these sessions can help you succeed in Physics with Calculus, such as getting help with problem-solving or understanding lecture material.
Try solving on your own before revealing the answer!
Final Answer:
The free help sessions are opportunities for any student to "drop in" and get assistance with physics concepts, homework, or exam preparation from instructors or teaching assistants. They are designed to support student learning and provide guidance outside of regular class hours.
Q2. Considering the worksheet problem involving the motorcycle, which of the graphs below would best describe its position as a function of time?
Background
Topic: Kinematics and Motion Graphs
This question tests your ability to interpret position vs. time graphs for an object undergoing acceleration, such as a motorcycle speeding up and then slowing down.
Key Terms and Concepts:
Position (): The location of an object along a coordinate axis.
Time (): The independent variable representing the progression of events.
Acceleration: The rate of change of velocity, which affects the shape of the position vs. time graph.
Step-by-Step Guidance
Recall that for constant acceleration, the position vs. time graph is a parabola (quadratic curve).
Think about the motorcycle's motion: it starts at rest or a certain speed, accelerates, and then decelerates.
Compare the provided graphs to see which one shows a curve that matches the described motion (speeding up, then slowing down).
Identify features such as curvature, slope, and whether the graph shows increasing or decreasing position over time.
Try solving on your own before revealing the answer!
Final Answer:
The correct graph is the one that shows a parabolic curve, representing the changing position of the motorcycle as it accelerates and then decelerates. For constant acceleration, the position vs. time graph is quadratic.
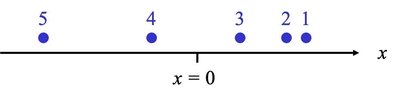
Q3. This is a motion diagram of an object moving along the x-direction with constant acceleration. The dots 1, 2, 3, … show the position of the object at equal time intervals ∆t.
Background
Topic: Motion Diagrams and Constant Acceleration
This question tests your ability to interpret motion diagrams and relate them to concepts of constant acceleration.
Key Terms:
Motion Diagram: A visual representation of an object's position at successive time intervals.
Constant Acceleration: The object's velocity changes by the same amount in each time interval.
Step-by-Step Guidance
Observe the spacing between the dots: if the object is accelerating, the spacing increases (or decreases) with each interval.
Relate the diagram to the equations of motion for constant acceleration.
Think about how the velocity changes as the object moves along the x-axis.
Try solving on your own before revealing the answer!
Final Answer:
The motion diagram shows increasing spacing between dots, indicating the object is accelerating in the x-direction. This matches the behavior expected for constant acceleration.
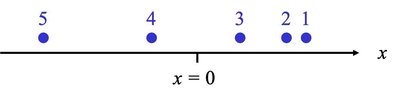
Q4. This is a motion diagram of an object moving along the x-direction with constant acceleration. The dots 1, 2, 3, … show the position of the object at equal time intervals ∆t.
Background
Topic: Motion Diagrams and Constant Acceleration
This question is similar to Q3 and tests your understanding of how constant acceleration affects the spacing of position markers in a motion diagram.
Key Terms:
Constant Acceleration: The object's velocity changes uniformly over time.
Motion Diagram: Visual representation of position at equal time intervals.
Step-by-Step Guidance
Examine the pattern of dots: are they getting farther apart or closer together?
Connect this pattern to the concept of acceleration: increasing spacing means speeding up, decreasing means slowing down.
Use the equations of motion to predict how the position changes with time under constant acceleration.
Try solving on your own before revealing the answer!
Final Answer:
The diagram shows the object accelerating, as indicated by the increasing distance between dots. This is characteristic of constant acceleration motion.
Q5. A BB is shot from a BB gun straight up from a height of 50.0 meters above the ground at a speed of 15.0 m/s. How long does it take the BB to reach its highest point?
Background
Topic: Kinematics – Free Fall and Vertical Motion
This question tests your ability to apply kinematic equations to vertical motion under gravity, specifically finding the time to reach the highest point.
Key Terms and Formulas:
Initial velocity (): The velocity at which the BB is shot upward.
Acceleration due to gravity (): (downward).
Highest point: Where the velocity becomes zero.
Key formula:
Step-by-Step Guidance
Set the final velocity at the highest point to zero: .
Write the equation for velocity as a function of time: .
Rearrange the equation to solve for time: .
Plug in the values for and (but do not calculate the final value yet).
Try solving on your own before revealing the answer!
Final Answer: 1.53 s
The BB takes approximately 1.53 seconds to reach its highest point after being shot upward.
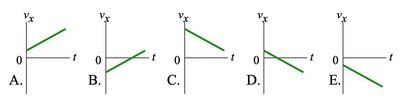
Q6. A BB is shot from a BB gun straight up from a height of 50.0 meters above the ground at a speed of 15.0 m/s. Which of the graphs below would best describe its velocity as a function of time?
Background
Topic: Kinematics – Velocity vs. Time Graphs for Free Fall
This question tests your ability to interpret velocity vs. time graphs for an object moving under gravity.
Key Terms:
Velocity (): The speed and direction of the BB's motion.
Time (): The independent variable.
Gravity (): Causes a constant downward acceleration.
Step-by-Step Guidance
Recall that the velocity decreases linearly with time due to constant acceleration (gravity).
At the highest point, velocity is zero; before that, it is positive (upward), and after, it becomes negative (downward).
Look for a graph that starts at a positive value and decreases linearly, crossing zero.
Compare the provided graphs to identify the one that matches this behavior.
Try solving on your own before revealing the answer!
Final Answer:
The correct graph is the one that starts at a positive velocity and decreases linearly, crossing zero at the highest point, then becoming negative as the BB falls back down.
Q7. Example: A ball is dropped from rest from a height of 1.0 m. Let up be (+). (a) How long does it take to reach the ground? (b) What is its velocity upon impact?
Background
Topic: Free Fall – Kinematic Equations
This question tests your ability to use kinematic equations to solve for time and velocity in free fall.
Key Terms and Formulas:
Initial velocity (): The ball is dropped from rest.
Height ( m): The distance the ball falls.
Acceleration due to gravity ( m/s): Downward.
Key formulas:
Step-by-Step Guidance
Set up the equation for position: (since ).
Set (ground level) and m.
Solve for in the equation .
Once you have , use to find the velocity upon impact.
Try solving on your own before revealing the answer!
Final Answer:
(a) s
(b) m/s
The ball takes about 0.45 seconds to reach the ground and hits with a velocity of approximately -4.4 m/s (downward).
