 Back
Physics with Calculus Practice Test Guidance
Study Guide - Smart Notes
 Tailored notes based on your materials, expanded with key definitions, examples, and context.
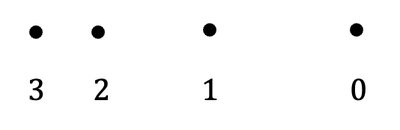
Q1. The motion diagram is for a person walking. What best describes the motion?
Background
Topic: Kinematics – Motion Diagrams
This question tests your ability to interpret a motion diagram and determine the direction and speed changes of a moving object.
Key Terms:
Motion diagram: A sequence of dots representing the position of an object at equal time intervals.
Direction: Which way the object is moving (left or right).
Speeding up/slowing down: Determined by the spacing between dots.
Step-by-Step Guidance
Observe the spacing between the dots. If the spacing decreases, the object is slowing down; if it increases, the object is speeding up.
Check the order of the numbers. If the numbers decrease from left to right, the object is moving to the left; if they increase, it's moving to the right.
Combine your observations to determine both the direction and whether the object is speeding up or slowing down.
Try solving on your own before revealing the answer!
Final Answer: The person is moving to the left, slowing down (D).
The numbers decrease from left to right, indicating leftward motion. The dots get closer together, showing the person is slowing down.
Q2. Which of the following graphs of velocity versus time could be for a particle that has an acceleration that is increasing at a constant rate?
Background
Topic: Kinematics – Acceleration and Velocity Graphs
This question tests your ability to interpret velocity-time graphs and recognize patterns of changing acceleration.
Key Terms and Formulas:
Acceleration (): The rate of change of velocity with respect to time.
Constant acceleration: , velocity changes linearly.
Increasing acceleration: increases with time, velocity changes non-linearly (curved graph).
Step-by-Step Guidance
Recall that a straight line on a vs graph indicates constant acceleration.
A curved line (parabolic or higher order) indicates changing acceleration.
Look for a graph where the slope (acceleration) itself increases with time.
Try solving on your own before revealing the answer!
Final Answer: Graph II (curved upward) shows increasing acceleration at a constant rate.
The slope of the velocity-time graph increases with time, indicating acceleration is increasing.
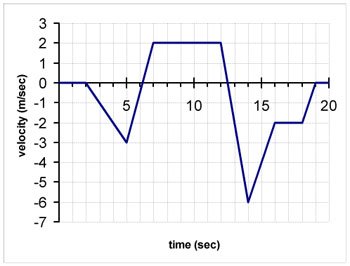
Q3. The graph to the right shows the velocity as a function of time for a particle moving in one dimension. What is the displacement during the time interval from 2s to 5s?
Background
Topic: Kinematics – Displacement from Velocity-Time Graphs
This question tests your ability to calculate displacement by finding the area under a velocity-time graph.
Key Terms and Formulas:
Displacement (): The area under the velocity-time curve between two times.
For straight segments, area can be calculated as rectangles or triangles.
Step-by-Step Guidance
Identify the section of the graph between s and s.
Determine the shape(s) under the curve in this interval (rectangle, triangle, etc.).
Calculate the area for each shape, remembering to account for positive or negative values (above or below the axis).
Add the areas to find the total displacement for the interval.
Try solving on your own before revealing the answer!
Final Answer: Displacement is −4.5 m.
The area under the curve from 2s to 5s is negative, indicating motion in the negative direction.
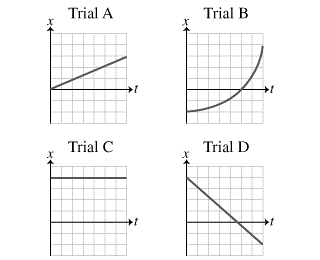
Q4. During which trial or trials is the object accelerating?
Background
Topic: Kinematics – Position vs Time Graphs
This question tests your ability to recognize acceleration from position-time graphs.
Key Terms:
Acceleration: Change in velocity over time.
Position-time graph: Curved lines indicate acceleration; straight lines indicate constant velocity.
Step-by-Step Guidance
Look for curves in the position-time graphs. A curve means the velocity is changing, so there is acceleration.
Identify which trials have curved lines (not straight).
Compare all four trials to see which ones show acceleration.
Try solving on your own before revealing the answer!
Final Answer: Trials B and D show acceleration.
Trial B is curved upward, and Trial D is curved downward, indicating acceleration.
Q5. During which trial or trials is the average speed for the entire trial the largest?
Background
Topic: Kinematics – Average Speed from Position-Time Graphs
This question tests your ability to compare average speeds using position-time graphs.
Key Terms:
Average speed: Total distance traveled divided by total time.
Steeper slope: Indicates higher speed.
Step-by-Step Guidance
Compare the slopes of the position-time graphs for each trial.
The steeper the slope, the greater the speed.
Identify which trial(s) have the steepest slopes throughout the interval.
Try solving on your own before revealing the answer!
Final Answer: Trials B and D have the largest average speed.
Both trials show the greatest change in position over time, indicating higher average speed.
