 Back
BackPotential Energy Curves and Energy Conservation in Physics
Study Guide - Smart Notes
 Tailored notes based on your materials, expanded with key definitions, examples, and context.
Potential Energy Curves
Introduction to Potential Energy Curves
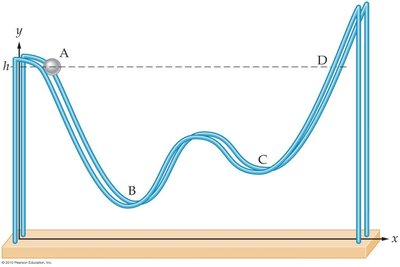
Potential energy curves are graphical representations that show how the potential energy of a system varies with position. They are essential tools in physics for analyzing the motion and energy transformations of objects under conservative forces, such as gravity or molecular forces.
Potential Energy (U): The energy stored in a system due to its position or configuration.
Kinetic Energy (K): The energy of motion, given by .
Total Mechanical Energy (E): The sum of kinetic and potential energies, .
Example: A ball moving along a frictionless track, where its height determines its gravitational potential energy.
Calculating Gravitational Potential Energy
For an object of mass m at height y above a reference point (where ), the gravitational potential energy is:
At position A ( m): J
At position B ( m): J
At position C ( m): J
At position D ( m): J
Key Point: The potential energy changes proportionally with the vertical position of the ball.
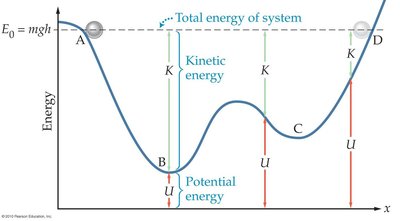
Energy Conservation and Potential Energy Curves
The total mechanical energy of a system (in the absence of non-conservative forces like friction) remains constant:
As the ball moves down, potential energy decreases and kinetic energy increases.
As the ball moves up, potential energy increases and kinetic energy decreases.
Interpreting Potential Energy Graphs
Potential energy curves can be plotted as versus (or ), showing how energy changes with position. The shape of the curve reflects the physical constraints and forces acting on the system.
Potential Well: A region where the potential energy is lower than surrounding areas, often trapping the object in a "bound state."
Turning Points: Points where the total energy equals the potential energy (), marking the limits of motion.

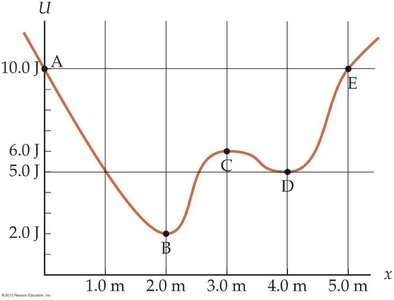
Energy Analysis at Specific Points
Tabulating Energy Values
For a ball released from rest at point A, the energies at various points are:
Point | Total Energy (E) | Kinetic Energy (K) | Potential Energy (U) |
|---|---|---|---|
A | 10 J | 0 J | 10 J |
B | 10 J | 8 J | 2 J |
C | 10 J | 4 J | 6 J |
D | 10 J | 5 J | 5 J |
E | 10 J | 0 J | 10 J |
Direction of Force from Potential Energy Curve
The force associated with a potential energy curve is given by the negative slope of the curve:
Negative slope: Force points to the right.
Positive slope: Force points to the left.
Zero slope: No net force (equilibrium point).
Example: At point A, the force pushes the ball to the right; at point E, to the left; at points B, C, D, the force is zero (equilibrium).
Bound States and Potential Wells
Definition of Bound State
A bound state occurs when an object’s total energy is less than the maximum potential energy barrier, confining it within a certain region. The object cannot escape the potential well unless additional energy is provided.
For a ball in a potential well, if , it is bound between two turning points.
Potential Energy Curves in Chemical Bonds
Potential Energy Curve for H2 Molecule
The potential energy curve for two hydrogen atoms shows how their potential energy changes with interatomic spacing. The minimum of the curve corresponds to the most stable (bonded) configuration.
As atoms move apart, potential energy approaches zero (no interaction).
The steep rise at short distances is due to the Pauli exclusion principle (repulsion).
Bond Length: The average distance between atoms in a molecule, typically at the minimum of the potential energy curve.
Energy Required to Break a Bond
To break a chemical bond, the system’s total energy must reach or exceed the value where the atoms are infinitely separated (usually defined as ).
Minimum energy to break the bond: The energy difference between the bound state and .
Example: For H2, if the minimum of the potential energy curve is at J, then at least J must be added to reach .
Summary Table: Key Concepts in Potential Energy Curves
Concept | Definition/Formula | Example/Application |
|---|---|---|
Potential Energy (U) | Ball at height y above ground | |
Kinetic Energy (K) | Ball moving with velocity v | |
Total Energy (E) | Conserved in frictionless systems | |
Force from U(x) | Direction of force from slope of U(x) | |
Bound State | Object trapped in potential well | |
Bond Energy | Energy to reach | Breaking H2 bond |
Practice and Application
Calculate the energies at various points on a potential energy curve.
Determine the direction of force from the slope of the potential energy curve.
Identify bound states and the energy required to escape a potential well.
Apply these concepts to both mechanical systems (e.g., ball on a track) and molecular systems (e.g., chemical bonds).
