 Back
BackRepresenting Motion: Position, Velocity, and Acceleration in One Dimension
Study Guide - Smart Notes
 Tailored notes based on your materials, expanded with key definitions, examples, and context.
Representing Motion
Coordinate Systems and Position
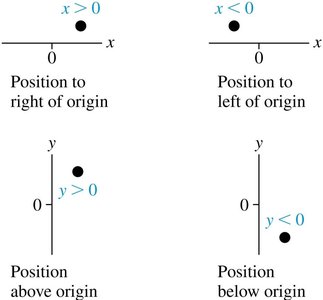
To analyze motion, we use coordinate axes to define positions in space. The x-axis is typically used for horizontal motion (positive to the right), and the y-axis for vertical motion (positive upward). The choice of axes is flexible, but must be clearly indicated in your work.
Position is the location of an object relative to an origin (0 point) on the axis.
Positions to the right/above the origin are positive; to the left/below are negative.
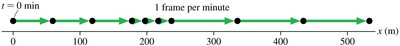
Motion Diagrams
A motion diagram visually represents an object's position at successive time intervals. Each dot corresponds to the object's position at a particular time, and arrows indicate direction and relative speed.
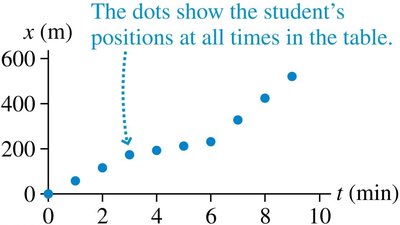
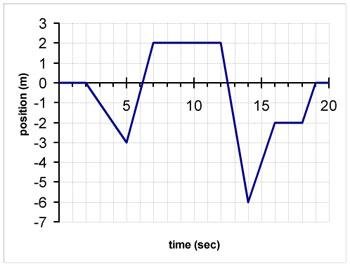
Position vs. Time Graphs
Plotting position (x) versus time (t) provides a graphical representation of motion. The slope of the graph at any point indicates the object's velocity.
A straight line indicates constant velocity.
A curve indicates changing velocity (acceleration).
From Position to Velocity
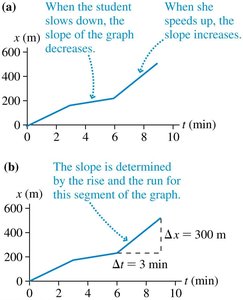
Understanding Slope and Velocity
The slope of a position-versus-time graph gives the velocity of the object. A steeper slope means a higher speed.
Average velocity is the total displacement divided by the total time interval.
Mathematically:
Velocity is a vector (has both magnitude and direction).
Examples and Applications
Consider a skateboard's position tracked over time. The velocity at a specific time can be found by calculating the slope of the tangent to the curve at that point.
If the graph is flat (slope = 0), the object is at rest.
Positive slope: moving in the positive direction; negative slope: moving in the negative direction.
Summary Table: Reading Position vs Time Graphs
Graph Feature | Physical Meaning |
|---|---|
Above x-axis | Positive position |
Below x-axis | Negative position |
Straight line | Constant velocity |
Curved line | Changing velocity (acceleration) |
Velocity vs. Time Graphs
Constructing Velocity Graphs
A velocity-versus-time graph can be deduced from the position-versus-time graph. The value of velocity at each instant is the slope of the position graph at that time.
Constant velocity: horizontal line.
Changing velocity: sloped or curved line.
Displacement from Velocity Graphs
The displacement () over a time interval is equal to the area under the velocity-versus-time graph during that interval.
For constant velocity, area is a rectangle:
For changing velocity, area may be more complex (e.g., triangle, trapezoid).
Instantaneous Velocity
Definition and Calculation
Instantaneous velocity is the velocity of an object at a specific instant in time. It is found as the slope of the tangent to the position-versus-time curve at that point.
For a curve, draw a tangent line at the desired point and calculate its slope.
Mathematically:
Acceleration
Average and Instantaneous Acceleration
Acceleration is the rate of change of velocity with respect to time. It is a vector quantity, with SI units of m/s2.
Average acceleration:
Acceleration can be positive or negative, depending on whether the object is speeding up or slowing down and the direction of motion.
Example Problem: Lion's Acceleration
A lion accelerates from rest at for 1 second. How long to reach ?
Known: , ,
Equation:
Solve for :
Example Problem: Skater's Acceleration
Alice skates east at , then accelerates west at .
Find final velocity after 3.0 s and 6.0 s, and describe the motion.
Equation:
Direction matters: acceleration is opposite to initial velocity.
Summary Table: Key Kinematic Quantities
Quantity | Definition | SI Unit |
|---|---|---|
Position () | Location relative to origin | m |
Displacement () | Change in position | m |
Velocity () | Rate of change of position | m/s |
Acceleration () | Rate of change of velocity | m/s2 |
