 Back
BackStudy Guide: Motion, Position, Velocity, and Uniform Motion in Physics
Study Guide - Smart Notes
 Tailored notes based on your materials, expanded with key definitions, examples, and context.
Q1. Which of the three carts appears to move with constant speed? Explain how you can tell.
Background
Topic: Kinematics – Constant Speed vs. Changing Speed
This question tests your ability to analyze position-time data to determine whether an object moves at a constant speed.
Key Terms and Formulas:
Constant speed: The object covers equal distances in equal time intervals.
Position-time table: Shows how the position changes over time.
Speed formula:
Step-by-Step Guidance
Examine the position-time tables for each cart. Look for patterns in how the position changes as time increases.
Calculate the change in position for each time interval for each cart. Are the increments equal?
Compare the increments for each cart. If a cart's position increases by the same amount each time, it moves at constant speed.
Explain your reasoning based on your calculations and observations.
Try solving on your own before revealing the answer!
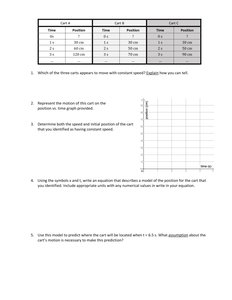
Q2. Represent the motion of this cart on the position vs. time graph provided.
Background
Topic: Graphical Representation of Motion
This question tests your ability to translate position-time data into a graphical format.
Key Terms and Formulas:
Position vs. time graph: Plots position (y-axis) against time (x-axis).
For constant speed, the graph should be a straight line.
Step-by-Step Guidance
Identify the time and position values for the cart moving at constant speed.
Mark each data point on the graph at the corresponding time and position.
Connect the points. If the cart moves at constant speed, the points should form a straight line.
Try plotting the graph before checking the answer!
Q3. Determine both the speed and initial position of the cart that was identified as having constant speed.
Background
Topic: Calculating Speed and Initial Position
This question tests your ability to use position-time data to calculate speed and identify the starting position.
Key Terms and Formulas:
Speed:
Initial position: The position at time .
Step-by-Step Guidance
Find the position at for the cart. This is the initial position.
Choose two points from the cart's data and calculate the change in position and change in time.
Use the speed formula to calculate the cart's speed.
Try calculating before checking the answer!
Q4. Using the symbols x, v, and t, write an equation that describes a model of the position for the cart that you identified, include appropriate units with any numerical values in your equation.
Background
Topic: Mathematical Modeling of Motion
This question tests your ability to write a position equation for an object moving at constant speed.
Key Terms and Formulas:
Position equation for constant speed:
= initial position, = speed, = time
Step-by-Step Guidance
Identify the values for and from previous steps.
Write the equation using these values and the correct units.
Try writing the equation before checking the answer!
Q5. Use this model to predict where the cart will be located when t = 6 s. What assumption about the cart’s motion is necessary to make this prediction?
Background
Topic: Predicting Future Position Using a Model
This question tests your ability to use a mathematical model to predict future position and understand the assumptions involved.
Key Terms and Formulas:
Position equation:
Assumption: The cart continues to move at constant speed.
Step-by-Step Guidance
Substitute s into your position equation.
State the assumption that the cart’s speed remains constant for the prediction to be valid.
Try predicting before checking the answer!
Q6. Draw a velocity vs. time graph for the situation described above (person running, stopping, and returning).
Background
Topic: Velocity-Time Graphs
This question tests your ability to represent changes in velocity over time graphically.
Key Terms and Formulas:
Velocity vs. time graph: Plots velocity (y-axis) against time (x-axis).
Constant velocity: Horizontal line; zero velocity: line at y = 0; negative velocity: line below y = 0.
Step-by-Step Guidance
Identify the three stages: running right, stopping, running left.
Draw horizontal lines for each stage at the appropriate velocity values.
Mark transitions between stages at the correct times.
Try sketching the graph before checking the answer!
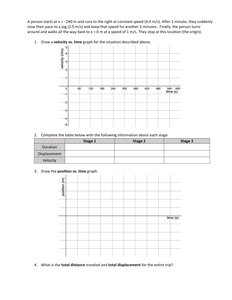
Q7. Complete the table below with the following information about each stage: duration, distance, displacement.
Background
Topic: Distance vs. Displacement
This question tests your understanding of the difference between distance (total path length) and displacement (change in position).
Key Terms and Formulas:
Distance: Total length traveled, regardless of direction.
Displacement: Net change in position from start to end.
Duration: Time spent in each stage.
Step-by-Step Guidance
For each stage, calculate the duration using the information given.
Calculate the distance traveled in each stage (speed × time).
Determine the displacement for each stage (consider direction).
Try filling in the table before checking the answer!
Q8. Draw the position vs. time graph for the person’s trip.
Background
Topic: Position-Time Graphs for Multiple Stages
This question tests your ability to represent a multi-stage trip on a position-time graph.
Key Terms and Formulas:
Position vs. time graph: Shows how position changes during each stage.
For constant speed, the graph is a straight line; for stopping, the graph is flat.
Step-by-Step Guidance
Mark the initial position and plot the change in position for each stage.
Draw straight lines for constant speed, flat lines for stopping, and lines with negative slope for returning.
Try drawing the graph before checking the answer!
Q9. What is the total distance traveled and total displacement for the entire trip?
Background
Topic: Calculating Total Distance and Displacement
This question tests your ability to distinguish between total distance and displacement for a round trip.
Key Terms and Formulas:
Total distance: Sum of all distances traveled in each stage.
Total displacement: Difference between final and initial positions.
Step-by-Step Guidance
Add up the distances for each stage to find the total distance.
Subtract the initial position from the final position to find the total displacement.
Try calculating before checking the answer!
Q10. Which object's motion (AA or BB) better shows uniform motion? Clearly write your choice, and you must explain how you decided, based on the data.
Background
Topic: Uniform Motion vs. Non-Uniform Motion
This question tests your ability to analyze position-time data to identify uniform motion.
Key Terms and Formulas:
Uniform motion: Constant velocity, equal position increments per time interval.
Position-time table: Used to check for uniform increments.
Step-by-Step Guidance
Examine the position-time tables for both objects.
Calculate the change in position for each time interval for both objects.
Compare the increments to determine which object moves with uniform motion.
Try analyzing before checking the answer!
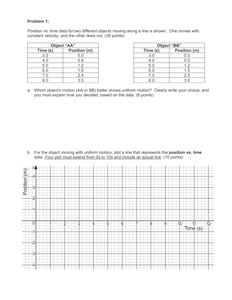
Q11. For the object moving with uniform motion, plot a line that represents the position vs. time data. The plot must cover all data points and include an actual line (not just points).
Background
Topic: Graphing Uniform Motion
This question tests your ability to graph position vs. time for an object moving at constant velocity.
Key Terms and Formulas:
Position vs. time graph: Straight line for uniform motion.
Step-by-Step Guidance
Plot each data point for the object with uniform motion.
Draw a straight line connecting the points.
Try plotting before checking the answer!
Q12. Do you agree or disagree with the following statement? Explain your reasoning. "The cart's speed was highest during the first stage."
Background
Topic: Analyzing Velocity-Time Graphs
This question tests your ability to interpret velocity-time graphs and compare speeds in different stages.
Key Terms and Formulas:
Velocity-time graph: Shows speed at each stage.
Highest speed: Largest value on the velocity axis.
Step-by-Step Guidance
Examine the velocity-time graph and identify the speed values for each stage.
Compare the values to determine which stage has the highest speed.
Explain your reasoning based on the graph.
Try reasoning before checking the answer!
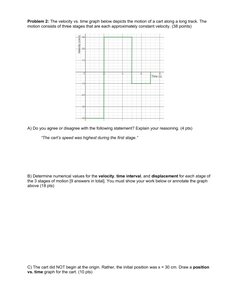
Q13. Determine numerical values for the velocity, time interval, and displacement for each stage of the 3 stages of motion (3 answers in total). You must show your work below or annotate the graph above.
Background
Topic: Calculating Motion Parameters from Graphs
This question tests your ability to extract numerical values from a velocity-time graph.
Key Terms and Formulas:
Velocity: Value from the graph for each stage.
Time interval: Duration of each stage.
Displacement:
Step-by-Step Guidance
Read the velocity value for each stage from the graph.
Determine the time interval for each stage.
Calculate the displacement for each stage using the formula.
Try calculating before checking the answer!
Q14. The cart did NOT begin at the origin. Rather, the initial position was x = 30 cm. Draw a position vs. time graph for the cart.
Background
Topic: Position-Time Graphs with Non-Zero Initial Position
This question tests your ability to graph motion starting from a non-zero initial position.
Key Terms and Formulas:
Initial position: cm
Position vs. time graph: Start at instead of zero.
Step-by-Step Guidance
Mark the initial position at cm on the graph.
Plot the subsequent positions based on the cart's motion.
Try plotting before checking the answer!
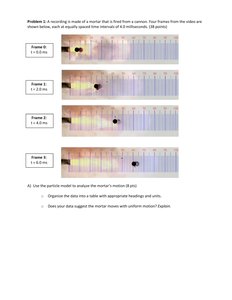
Q15. Use the particle model to analyze the mortar’s motion. Organize the data into a table with appropriate headings and units. Does your data suggest the mortar moves with uniform motion? Explain.
Background
Topic: Particle Model and Uniform Motion Analysis
This question tests your ability to use the particle model to analyze motion and determine if it is uniform.
Key Terms and Formulas:
Particle model: Represents the object as a series of dots at equal time intervals.
Uniform motion: Equal spacing between dots indicates constant speed.
Step-by-Step Guidance
Measure the distance between the mortar's positions in each frame.
Organize the data into a table with columns for time and position.
Analyze whether the spacing is consistent, indicating uniform motion.
Try organizing and analyzing before checking the answer!
Final Answer: See below for sample answers and explanations.
Each question's final answer would include the specific cart/object identified, calculated values, completed graphs, and explanations based on the data and models provided. For example, for Q1, the cart with equal position increments is the one moving at constant speed. For Q15, if the mortar's positions are equally spaced, it moves with uniform motion.
