 Back
BackThermal Properties of Matter and the Kinetic Theory of Gases
Study Guide - Smart Notes
 Tailored notes based on your materials, expanded with key definitions, examples, and context.
Thermal Properties of Matter
Introduction to Thermodynamics
Thermodynamics is the study of the thermal energy (internal energy) of systems and its application. At the macroscopic scale, temperature is a property that determines the direction and amount of heat exchanged between objects in thermal contact. Heat (Q) is energy transferred due to a temperature difference between a system and its environment.
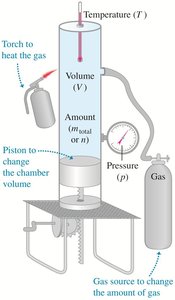
State Variables and Equations of State
State variables such as pressure (p), volume (V), temperature (T), and amount of substance (n) describe the state of a substance. The equation of state relates these variables, and for an ideal gas, the relationship is given by the ideal-gas law.
Pressure (p): Force per unit area exerted by gas molecules on the container walls.
Volume (V): Space occupied by the gas.
Temperature (T): Measure of average kinetic energy of molecules.
Amount (n): Number of moles of the substance.
Ideal-Gas Law
The ideal-gas law is an equation of state for an ideal gas, derived from experimental observations:
Volume is proportional to number of moles (at constant p and T).
Volume is inversely proportional to pressure (at constant n and T).
Pressure is proportional to temperature (at constant n and V).
The ideal-gas law is:
Where R is the universal gas constant, with a value:
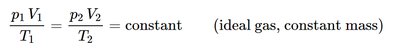
Relationships for Constant Mass
For a constant mass (or number of moles) of an ideal gas, the following relationship holds:

Example: Automobile Engine Compression
In an automobile engine, a mixture of air and gasoline vapor is compressed. If the initial temperature is 27°C, initial pressure is 1.00 atm, final pressure is 21.7 atm, and the compression ratio is 9:1, the final temperature can be calculated using the ideal-gas law:

Atmospheric Pressure Variation with Elevation
The variation of atmospheric pressure with elevation can be derived using fluid mechanics and the ideal-gas law. Assuming constant temperature and gravity:
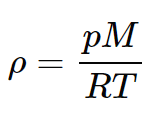
Where is the density of the fluid, is acceleration due to gravity, and are heights. Using the ideal-gas law, the density is:
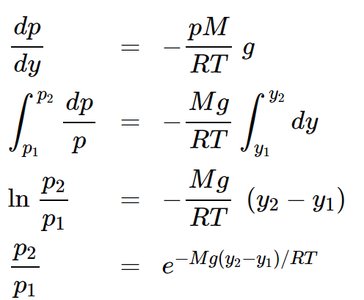
Integrating, we obtain:

pV Diagrams and Nonideal Gases
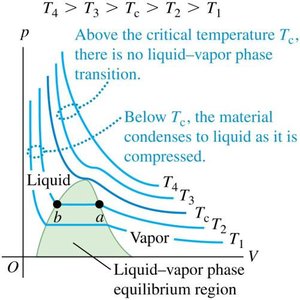
pV Diagrams for Ideal Gases
pV diagrams show isotherms (constant-temperature curves) for a constant amount of an ideal gas. Each curve represents pressure as a function of volume at a single temperature.
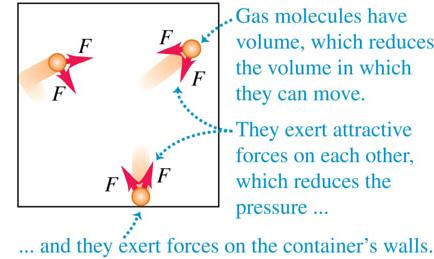
Nonideal Gases and van der Waals Equation
The ideal-gas model ignores molecular volume and intermolecular forces. The van der Waals equation provides a more realistic model:
Accounts for finite molecular volume.
Includes attractive forces between molecules.
Molecular Properties of Matter
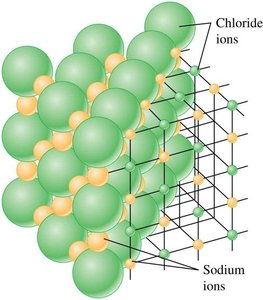
Molecular Structure and Intermolecular Forces
Bulk behavior of matter is determined by molecular structure. In gases, molecules move nearly independently, and intermolecular forces vary with separation distance (r).


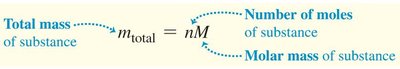
Mole, Molar Mass, and Avogadro's Number
One mole of a substance contains Avogadro’s number () of molecules. The molar mass (M) is the mass of one mole.


Kinetic-Molecular Model of an Ideal Gas
Assumptions of the Model
The kinetic-molecular model explains macroscopic properties in terms of molecular behavior:
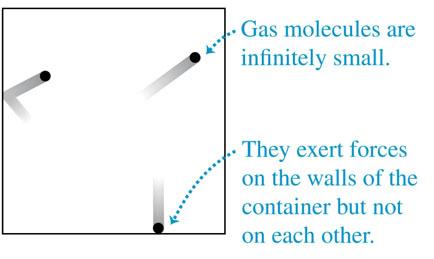
Large number of identical molecules.
Molecules are point particles, small compared to container size.
Molecules are in constant motion and undergo perfectly elastic collisions.
Container walls are rigid.

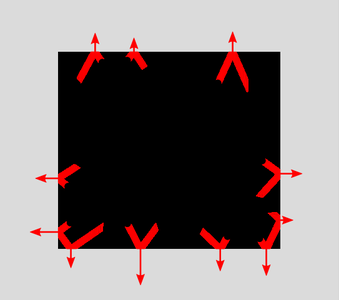
Origin of Pressure
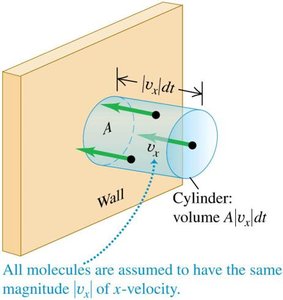
Pressure arises from collisions of molecules with container walls. The velocity component perpendicular to the wall reverses direction, while the parallel component remains unchanged.
Quantitative Analysis of Collisions
The number of collisions per unit time for a wall area A is determined by the number of molecules within a cylinder of volume headed toward the wall.

The average number of molecules colliding with area A during dt is:
Pressure and Kinetic Energy
The pressure exerted by the gas is related to the average kinetic energy of the molecules:

Translational Kinetic Energy and Temperature
The total random kinetic energy of translational motion is directly proportional to absolute temperature:
For a single molecule:
Boltzmann constant:
Root-Mean-Square Speed
The root-mean-square (rms) speed of molecules is:
Mean Free Path and Collisions
The mean free path is the average distance a molecule travels between collisions. It depends on molecular size and density.
Heat Capacities and Degrees of Freedom
Degrees of Freedom and Equipartition of Energy
Degrees of freedom are the number of independent velocity components needed to describe a molecule. The equipartition principle states each degree of freedom has of kinetic energy.
Monatomic gas: 3 degrees of freedom.
Diatomic gas: 5 degrees of freedom.
Heat Capacity of Solids
In a crystal, each atom has both kinetic and potential energy, leading to a molar heat capacity:
Molecular Speeds and Maxwell-Boltzmann Distribution
Maxwell-Boltzmann Distribution
The Maxwell-Boltzmann distribution describes the distribution of molecular speeds in a gas:
Phases of Matter and Phase Diagrams
Phase Transitions and Equilibrium
Phase transitions require equilibrium between phases, occurring at specific temperatures for a given pressure. Phase diagrams plot pressure vs. temperature, showing regions of stability for each phase.
pVT Surface
Graphical Representation of State Equations
A pVT-surface graphically represents the equation of state, with projections onto pT- and pV-planes.
Summary Table: Key Equations and Concepts
Concept | Equation | Description |
|---|---|---|
Ideal-Gas Law | Relates pressure, volume, temperature, and moles for ideal gases | |
Density of Ideal Gas | Density in terms of pressure, molar mass, and temperature | |
Pressure Variation with Elevation | Atmospheric pressure change with height | |
Translational Kinetic Energy | Average kinetic energy per molecule | |
Maxwell-Boltzmann Distribution | Distribution of molecular speeds |
Additional info: Academic context and explanations have been expanded for clarity and completeness.
