 Back
BackWave Properties and Oscillations: Analyzing Amplitude and Frequency
Study Guide - Smart Notes
 Tailored notes based on your materials, expanded with key definitions, examples, and context.
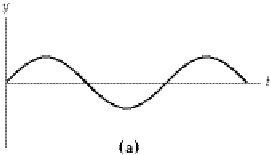
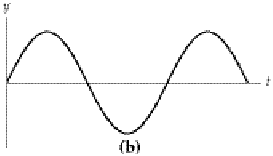
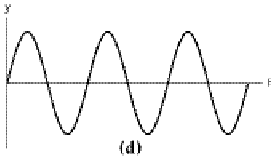
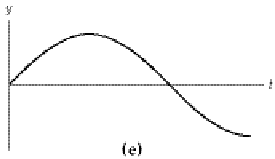
Q5. Which of the graphs below shows a wave where the amplitude and the frequency are doubled?
Background
Topic: Wave Properties (Amplitude and Frequency)
This question tests your understanding of how changes in amplitude and frequency affect the appearance of a wave on a graph. Amplitude is the maximum displacement from equilibrium, and frequency is the number of cycles per unit time.
Key Terms and Formulas
Amplitude (): The maximum value of displacement from the equilibrium position.
Frequency (): The number of oscillations per second (measured in Hz).
Period (): The time for one complete cycle, .
Wave Equation:
Step-by-Step Guidance
Examine the original wave graph and note its amplitude and frequency. The amplitude is the peak value (vertical distance from equilibrium), and the frequency is related to how many cycles occur in a given time interval.
To double the amplitude, the peaks and troughs should be twice as far from the equilibrium line compared to the original graph.
To double the frequency, the wave should complete twice as many cycles in the same time interval. This means the wave will look more "compressed" horizontally.
Compare each provided graph to see which one has both a higher amplitude and more cycles (higher frequency) than the original.
Try solving on your own before revealing the answer!
Final Answer: Graph (d)
Graph (d) shows a wave with both doubled amplitude and doubled frequency compared to the original. The peaks are higher and there are twice as many cycles in the same interval.
