- Download the worksheet to save time writing
- Start solving the practice problems
- If you're stuck, watch the video solutions
- See your summary to get more insights

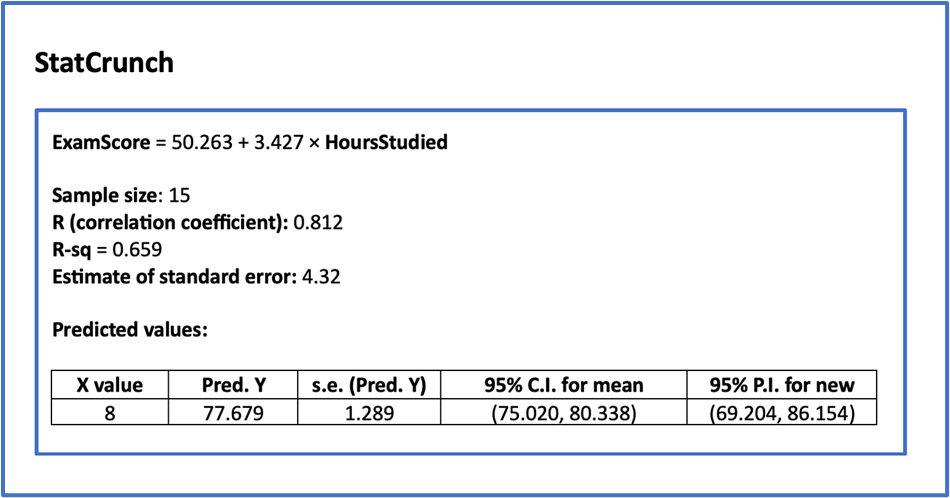
A researcher used regression analysis to study the relationship between the number of hours students studied and their final exam scores in a statistics course. The regression output below was generated using data from students. The model was then used to predict the exam score for a student who studied for hours. What is the predicted student's exam score?
A computer program randomly generates a digit from to . What is the sample space for this experiment, and how many possible outcomes are there?
A hospital has nurses and doctors. Of the nurses, have completed advanced training, while doctors have completed advanced training. Are the events "being a nurse" and "having completed advanced training" independent?
In a manufacturing process, the probability that an item is defective is . For a quality check involving four randomly selected items, determine the following:
The probability that all four items are non-defective.
A cafe analyzed whether customers tipped based on their payment method. Some customers paid with cash, while others paid by card. The results are shown below:
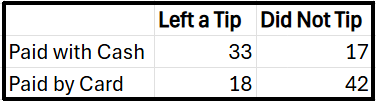
What is the probability that a customer did not tip, given that the customer paid by card?
The probability that an event will not occur is given below. Find the probability that the event will occur.
A survey of college students was conducted to study risky behaviors. The results showed the following:
- students admitted to speeding regularly.
- students admitted to using their phones while biking.
- students admitted to doing both.
If one student is randomly selected from this group, what is the probability that the student either sped regularly or used a phone while biking, but not both?
If the probability of event A is 0.2 and the probability of event B is 0.3, what is the probability of either event A or event B occurring if they are mutually exclusive?
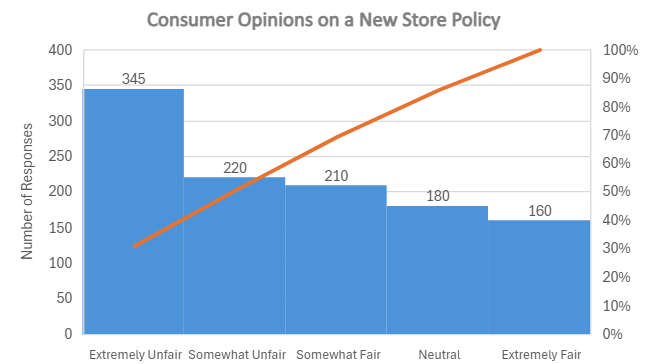
A consumer feedback agency surveyed shoppers to assess their opinions on a new store policy that limits return periods to days. The summary of responses is shown in the Pareto chart. What is the probability of selecting a shopper who believes the policy is extremely unfair?