Dot Plots
- Download the worksheet to save time writing
- Start solving the practice problems
- If you're stuck, watch the video solutions
- See your summary to get more insights

Dot Plots
3 problems
Problem 1Multiple Choice
The stem-and-leaf plot with two rows for each stem shows the heights, in inches, of a group of plants. Display this data in a dot plot.
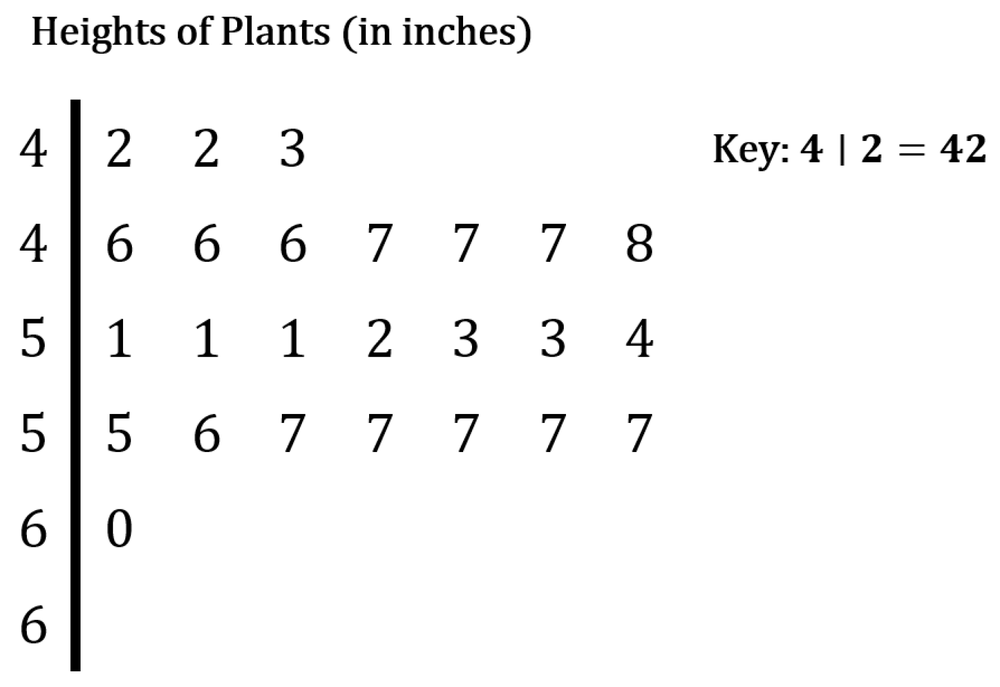
What is one key difference between how the stem-and-leaf plot and the dot plot display the data?
Problem 3Multiple Choice
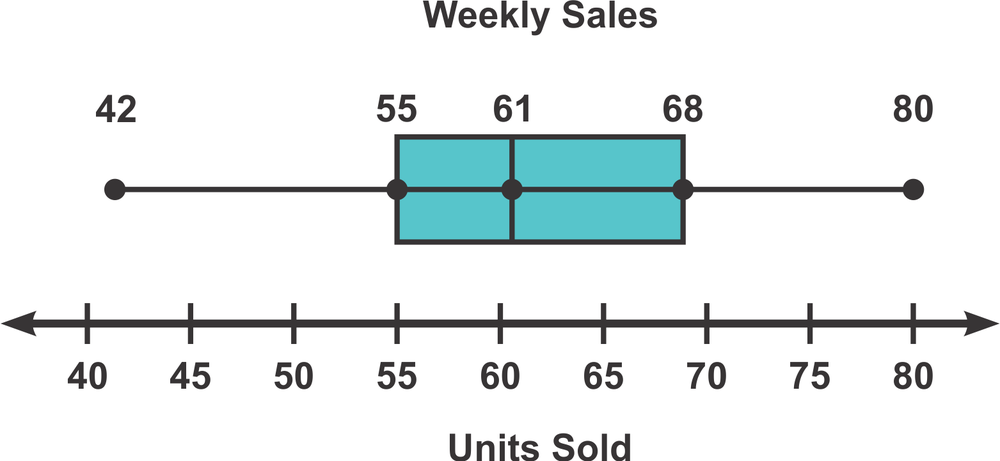
The box and whisker plot shown represents the weekly sales in units of its sales representatives. What percentage of the sales representatives sold more than units in a week?