2. Describing Data with Tables and Graphs / Dot Plots / Problem 1
Problem 1
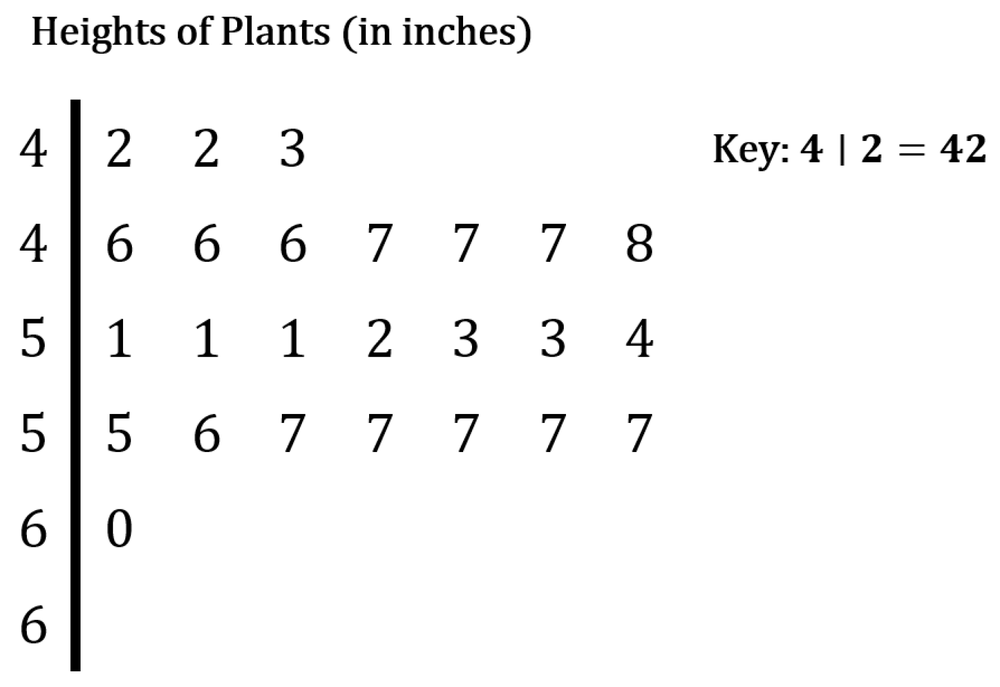
The stem-and-leaf plot with two rows for each stem shows the heights, in inches, of a group of plants. Display this data in a dot plot. What is one key difference between how the stem-and-leaf plot and the dot plot display the data?