Skip to main content
Statistics
My Course
Learn
Exam Prep
AI Tutor
Study Guides
Textbook Solutions
Flashcards
Explore
Try the app
My Course
Learn
Exam Prep
AI Tutor
Study Guides
Textbook Solutions
Flashcards
Explore
Try the app
Back
Hypothesis Testing: Means - Excel definitions
You can tap to flip the card.
Population Mean
You can tap to flip the card.
👆
Population Mean
Central value expected for an entire group, often denoted by the Greek letter μ and used as a reference in hypothesis testing.
Track progress
Control buttons has been changed to "navigation" mode.
1/15
Related flashcards
Related practice
Recommended videos
Hypothesis Testing: Means - Excel quiz
Hypothesis Testing: Means - Excel
15 Terms
9. Hypothesis Testing for One Sample
1 topic
3 problems
Chapter
David-Paige
04:28
Performing Hypothesis Tests: Mean Sigma Known - Excel Example 1
172
views
3
rank
05:10
Performing Hypothesis Tests: Mean Sigma Known - Excel
286
views
3
rank
09:06
Performing Hypothesis Tests: Mean Sigma Unknown - Excel Example 4
121
views
2
rank
Terms in this set (15)
Hide definitions
Population Mean
Central value expected for an entire group, often denoted by the Greek letter μ and used as a reference in hypothesis testing.
Null Hypothesis
Initial assumption stating no effect or difference, typically that the population mean equals a specified value.
Alternative Hypothesis
Statement representing the claim being tested, suggesting the population mean differs from the expected value.
Population Standard Deviation
Measure of spread for an entire group, symbolized by sigma, used when known to apply the Z.TEST function.
Sample Mean
Average value calculated from collected data, often used as an estimate for the population mean.
Sample Size
Number of observations in a dataset, denoted by n, crucial for calculations in hypothesis testing.
Degrees of Freedom
Value representing the number of independent data points minus one, important for t distribution calculations.
Sample Standard Deviation
Statistic measuring variability within collected data, used when population standard deviation is unknown.
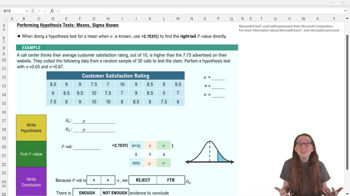
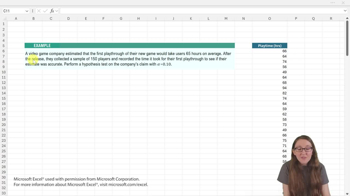
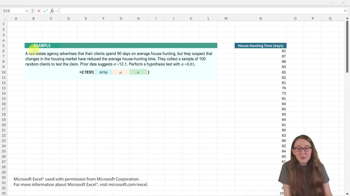
Z.TEST Function
Excel tool that computes right-tail p-values directly from sample data, expected mean, and known sigma.
T Distribution
Probability distribution used when sigma is unknown, relying on sample statistics and degrees of freedom.
T Score
Calculated value comparing sample mean to expected mean, adjusted for sample variability and size.
P Value
Probability indicating how extreme sample results are under the null hypothesis, guiding decision-making.
Significance Level
Threshold, often denoted by alpha, used to determine whether to reject the null hypothesis.
Right-Tail Test
Hypothesis test where the alternative suggests the population mean is greater than the expected value.
Left-Tail Test
Hypothesis test where the alternative suggests the population mean is less than the expected value.
 BackBack
 04:28
04:28