Skip to main content
Statistics
My Course
Learn
Exam Prep
AI Tutor
Study Guides
Textbook Solutions
Flashcards
Explore
Try the app
My Course
Learn
Exam Prep
AI Tutor
Study Guides
Textbook Solutions
Flashcards
Explore
Try the app
Back
Hypothesis Testing: Means - Excel quiz
You can tap to flip the card.
What is the first step in performing a hypothesis test for a population mean in Excel when sigma is known?
You can tap to flip the card.
👆
What is the first step in performing a hypothesis test for a population mean in Excel when sigma is known?
The first step is to state the null and alternative hypotheses for the population mean.
Track progress
Control buttons has been changed to "navigation" mode.
1/15
Related flashcards
Related practice
Recommended videos
Hypothesis Testing: Means - Excel definitions
Hypothesis Testing: Means - Excel
15 Terms
9. Hypothesis Testing for One Sample
1 topic
3 problems
Chapter
David-Paige
04:28
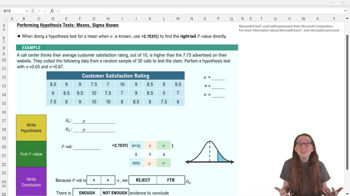
Performing Hypothesis Tests: Mean Sigma Known - Excel Example 1
171
views
3
rank
05:10
Performing Hypothesis Tests: Mean Sigma Known - Excel
285
views
2
rank
09:06
Performing Hypothesis Tests: Mean Sigma Unknown - Excel Example 4
121
views
2
rank
Terms in this set (15)
Hide definitions
What is the first step in performing a hypothesis test for a population mean in Excel when sigma is known?
The first step is to state the null and alternative hypotheses for the population mean.
What does the null hypothesis typically state in a hypothesis test for a population mean?
The null hypothesis states that the population mean (μ) is equal to the expected value.
What symbol is used in the alternative hypothesis when testing if the mean is greater than the expected value?
The greater than symbol (>) is used in the alternative hypothesis.
Which Excel function is used to calculate the right-tail p-value for a hypothesis test when sigma is known?
The Z.TEST function is used to calculate the right-tail p-value directly.
What are the three inputs required for the Z.TEST function in Excel?
The three inputs are the data array, the expected population mean (x), and the population standard deviation (sigma).
How do you interpret the p-value in relation to the significance level (alpha) in hypothesis testing?
If the p-value is less than alpha, you reject the null hypothesis; if it is greater, you fail to reject the null hypothesis.
What conclusion can you draw if the p-value is less than the significance level in a right-tail test?
You reject the null hypothesis and conclude there is enough evidence for the alternative hypothesis.
What should you do if you need a left-tail p-value but only have a right-tail function in Excel?
Use the complement rule to find the left-tail probability.
What is the expected population mean (μ) in the call center example?
The expected population mean is 7.75.
What is the population standard deviation (sigma) in the call center example?
The population standard deviation is 0.67.
What is the significance level (alpha) used in the call center hypothesis test example?
The significance level is 0.05.
What is the conclusion if the p-value is greater than alpha in a hypothesis test?
You fail to reject the null hypothesis, meaning there is not enough evidence for the alternative hypothesis.
When sigma is unknown, which distribution is used for hypothesis testing in Excel?
The t distribution is used when sigma is unknown.
Which Excel function is used to calculate the sample mean (x̄) from data?
The AVERAGE function is used to calculate the sample mean.
How do you calculate the p-value for a left-tail test using the t distribution in Excel?
Use the T.DIST function with the t score, degrees of freedom, and TRUE for cumulative probability.
 BackBack
 04:28
04:28