What is the general form of the quadratic regression equation used to model nonlinear data?
The general form of the quadratic regression equation is y = ax² + bx + c, where a, b, and c are coefficients determined from the data. This equation models data with a curved trend, and the coefficient a controls the curvature of the graph.
 Back
Back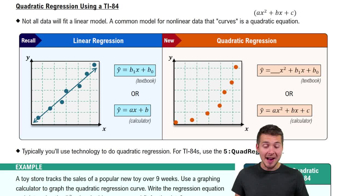
 07:11
07:11