 Back
Key Probability Distributions in Introductory Statistics
 06:06

Terms in this set (21)
The normal distribution is a continuous probability distribution that is symmetric and bell-shaped, characterized by its mean and standard deviation.
The normal distribution is defined by two parameters: the mean (μ) and the standard deviation (σ).
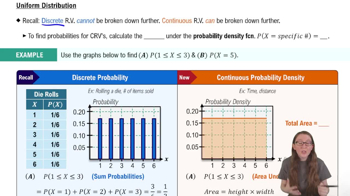
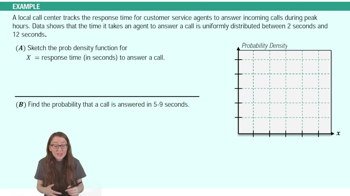
The uniform distribution has a constant probability over its range, resulting in a rectangular shape.
A uniform distribution is defined by two parameters: the minimum (a) and maximum (b) values, with equal probability between them.
The exponential distribution models the time between events in a Poisson process, such as waiting times.
The exponential distribution is defined by the rate parameter (λ), which is the inverse of the mean.
The PDF of the normal distribution is \(f(x) = \frac{1}{\sigma \sqrt{2\pi}} e^{-\frac{(x-\mu)^2}{2\sigma^2}}\).
The PDF is \(f(x) = \frac{1}{b - a}\) for \(a \leq x \leq b\), zero otherwise.
The PDF is \(f(x) = \lambda e^{-\lambda x}\) for \(x \geq 0\), zero otherwise.
The mean of the normal distribution is \(\mu\).
The variance is \(\sigma^2\), the square of the standard deviation.
The mean is \(\frac{a + b}{2}\).
The variance is \(\frac{(b - a)^2}{12}\).
The mean is \(\frac{1}{\lambda}\).
The variance is \(\frac{1}{\lambda^2}\).
Increasing σ makes the normal curve wider and flatter; decreasing it makes the curve narrower and taller.
Every value in the interval [a, b] is equally likely to occur.
The exponential distribution is memoryless, meaning the probability of an event occurring in the future is independent of the past.
It is used to model natural phenomena and measurement errors that cluster around a mean.
It models situations where all outcomes in a range are equally likely, such as rolling a fair die.
It models waiting times between independent events occurring at a constant average rate.