 Back
Addition Rule and Complements in Probability
Study Guide - Smart Notes
 Tailored notes based on your materials, expanded with key definitions, examples, and context.
5.2 The Addition Rule and Complements
Addition Rule for Disjoint Events
The Addition Rule is a fundamental concept in probability that allows us to calculate the probability of the union of two or more events. When events are disjoint (also called mutually exclusive), they have no outcomes in common.
Disjoint Events: Events that cannot occur at the same time. For example, drawing a chip labeled '2' and a chip labeled '8' from a bag in a single draw are disjoint events.
Addition Rule for Disjoint Events: If events E, F, G, ... are disjoint, then:
Example: Suppose the probability model for the number of rooms in a housing unit is as follows:
Number of Rooms | Probability |
|---|---|
One | 0.010 |
Two | 0.032 |
Three | 0.093 |
Four | 0.176 |
Five | 0.219 |
Six | 0.189 |
Seven | 0.122 |
Eight | 0.079 |
Nine or more | 0.080 |
Probability of two or three rooms:
Probability of one, two, or three rooms:
Note: Always verify that the sum of all probabilities in a probability model equals 1.
Addition Rule for Non-Disjoint Events (General Addition Rule)
When two events are not disjoint (i.e., they can occur together), the Addition Rule must be adjusted to avoid double-counting the outcomes they share.
General Addition Rule:
This formula subtracts the probability of the intersection (both events occurring) to correct for double-counting.
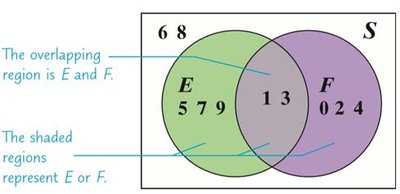
Example: Suppose E = "choose an odd number" and F = "choose a number less than or equal to 4" from chips labeled 0–9. E = {1,3,5,7,9}, F = {0,1,2,3,4}. The outcomes 1 and 3 are in both E and F.
Total outcomes in E or F: 8
Total outcomes in sample space: 10
Alternatively, using the formula: , ,
Example: If , , and , then:
If E and F are mutually exclusive, , so .
Addition Rule with Contingency Tables
Contingency tables (or two-way tables) organize data into categories and are useful for calculating probabilities involving two categorical variables.
Males (millions) | Females (millions) | |
|---|---|---|
Never Married | 45.3 | 40.1 |
Married | 68.5 | 69.3 |
Widowed | 3.5 | 11.4 |
Divorced | 10.7 | 14.8 |
Probability a resident is male:
Probability a resident is widowed:
Probability a resident is widowed or divorced: (since these are disjoint)
Probability a resident is male or widowed: Use the general addition rule:
Complement Rule
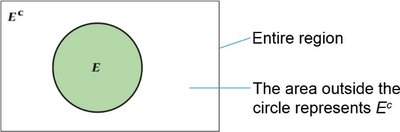
The complement of an event E, denoted as , consists of all outcomes in the sample space that are not in E. The probability of the complement is:
Example: If 31.6% of households own a dog, the probability that a randomly selected household does not own a dog is:
Using the Complement Rule with Frequency Tables
Frequency tables can be used to calculate probabilities for events and their complements.
Travel Time | Frequency |
|---|---|
Less than 5 minutes | 24,358 |
5 to 9 minutes | 39,112 |
10 to 14 minutes | 62,124 |
15 to 19 minutes | 72,854 |
20 to 24 minutes | 74,386 |
25 to 29 minutes | 30,099 |
30 to 34 minutes | 45,043 |
35 to 39 minutes | 11,169 |
40 to 44 minutes | 8,045 |
45 to 59 minutes | 15,650 |
60 to 89 minutes | 5,451 |
90 or more minutes | 4,895 |
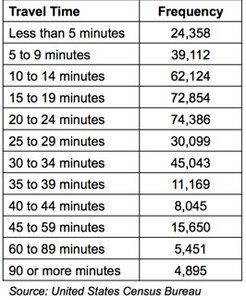
Probability of 90 or more minutes:
Probability of less than 90 minutes:
Additional info: To find the total, sum all frequencies in the table.
