 Back
BackAnalysis of Variance (ANOVA): Comparing More Than Two Groups
Study Guide - Smart Notes
 Tailored notes based on your materials, expanded with key definitions, examples, and context.
Analysis of Variance (ANOVA)
Introduction to ANOVA
Analysis of Variance (ANOVA) is a statistical method used to compare the means of three or more groups to determine if at least one group mean is significantly different from the others. ANOVA extends the t-test framework, which is limited to comparing two groups, by allowing for the analysis of multiple groups simultaneously. This method is widely used in experimental and observational studies where researchers are interested in understanding the effect of categorical independent variables (factors) on a continuous dependent variable.
Key Purpose: To test for significant differences among group means.
Factor: The independent variable (e.g., generation).
Levels: The categories within the factor (e.g., Gen Z, Millennials, Gen X, Boomers and older).
Types and Variations of ANOVA
One-Way and Factorial ANOVA
There are several types of ANOVA, each suited for different experimental designs:
One-Way ANOVA: Compares means across three or more independent groups based on a single factor.
Factorial ANOVA: Involves two or more factors, allowing for the examination of interaction effects between variables.
Repeated Measures ANOVA: Used when the same subjects are measured under different conditions or over time.
Mixed Factorial ANOVA: Combines independent and repeated measures factors.
Special Variations: ANCOVA (includes covariates), MANOVA (multiple dependent variables).
Concepts of Variance in ANOVA
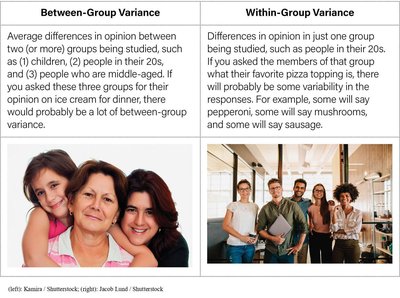
Between-Group and Within-Group Variance
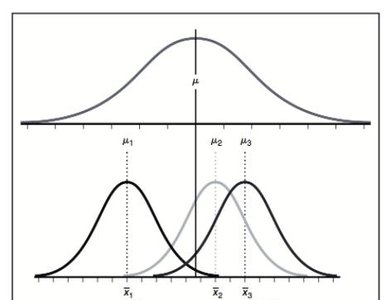
ANOVA partitions the total variance observed in the data into two components: between-group variance and within-group variance. Understanding these concepts is crucial for interpreting ANOVA results.
Between-Group Variance: Measures differences between the means of different groups (e.g., differences in climate change attitudes across generations).
Within-Group Variance: Measures variability within each group (e.g., differences in attitudes among Millennials).
Application Example: Generational Differences
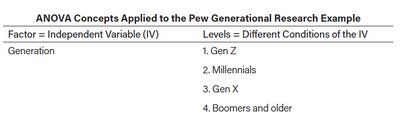
In research, factors and levels are defined based on the study design. For example, in a Pew generational study:
Factor = Independent Variable (IV) | Levels = Different Conditions of the IV |
|---|---|
Generation | 1. Gen Z 2. Millennials 3. Gen X 4. Boomers and older |
ANOVA Assumptions
Key Assumptions for Valid Results
For ANOVA results to be valid, several assumptions must be met:
Independence: Each observation is collected independently.
No Outliers: Outliers can distort group means and variances.
Normality: The distribution of the dependent variable within each group should be approximately normal (especially important for small sample sizes).
Homogeneity of Variance: The variance among groups should be roughly equal (tested with Levene’s test).
Calculating the F Ratio
F Statistic and Its Interpretation
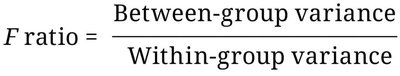
The F ratio is the test statistic used in ANOVA. It is calculated as the ratio of between-group variance to within-group variance. A larger F ratio suggests greater evidence against the null hypothesis (that all group means are equal).
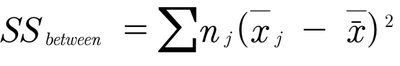
Formula:
Degrees of Freedom (df): Two types are used—one for between groups and one for within groups.
p Value: Indicates the probability that the observed differences occurred by chance.
ANOVA Table Structure
Components of the ANOVA Table
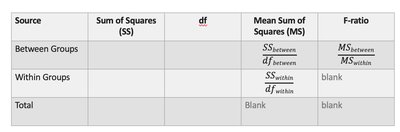
The results of an ANOVA are typically summarized in an ANOVA table, which includes the sum of squares (SS), degrees of freedom (df), mean squares (MS), and the F ratio for both between-group and within-group sources of variance.
Source | Sum of Squares (SS) | df | Mean Sum of Squares (MS) | F-ratio |
|---|---|---|---|---|
Between Groups | SSbetween | dfbetween | MSbetween = SSbetween/dfbetween | MSbetween/MSwithin |
Within Groups | SSwithin | dfwithin | MSwithin = SSwithin/dfwithin | |
Total | SStotal | dftotal |
Formulas for Sums of Squares
Partitioning Variance
ANOVA calculations involve partitioning the total sum of squares into between-group and within-group components:
Total Sum of Squares (SSTotal):
Between-Groups Sum of Squares (SSBetween):
Within-Groups Sum of Squares (SSWithin):
Effect Size in ANOVA
Eta Squared (η²)
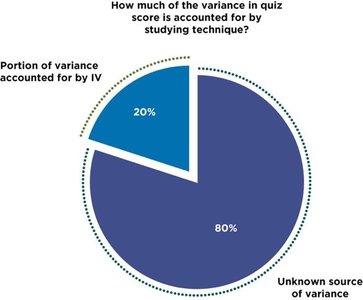
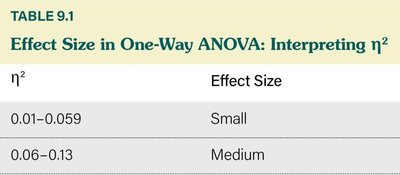
Effect size quantifies the proportion of total variance in the dependent variable that is attributable to the independent variable. In one-way ANOVA, eta squared (η²) is commonly used:
Formula:
Interpretation: Values range from 0 (no effect) to 1 (all variance explained by the factor).
η² | Effect Size |
|---|---|
0.01–0.059 | Small |
0.06–0.13 | Medium |
Above 0.13 | Large |
Post Hoc Tests
Identifying Specific Group Differences
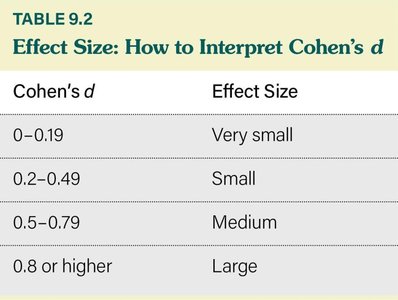
If the ANOVA is significant, post hoc tests are used to determine which specific group means differ from each other. Tukey’s HSD is a common post hoc test. Cohen’s d is used to measure the effect size between pairs of groups.
Cohen’s d | Effect Size |
|---|---|
0–0.19 | Very small |
0.2–0.49 | Small |
0.5–0.79 | Medium |
0.8 or higher | Large |
Type I Error and Multiple Comparisons
Controlling Familywise Error Rate
Conducting multiple t-tests increases the risk of Type I error (false positives). ANOVA controls this risk by analyzing all groups together. Post hoc tests further adjust for multiple comparisons, reducing the likelihood of spurious findings.
Type I Error: The probability of incorrectly rejecting a true null hypothesis increases with the number of comparisons.
Familywise Error Rate: The overall probability of making one or more Type I errors in a set of comparisons.

APA Style Reporting for One-Way ANOVA
Mini Report Structure
Results from an ANOVA are typically reported in APA style, including the F statistic, degrees of freedom, p value, and effect size. Descriptive statistics (n, M, SD) for each group are also provided, along with interpretations of post hoc tests if applicable.
Method: Describe the sample and variables studied.
Results: State the ANOVA findings, including statistical significance and effect size.
Discussion: Summarize the practical implications of the results in plain language.
Example: "A one-way ANOVA compared pain-scale data among participants in three intervention groups: audiobook, music, and silence. The ANOVA was statistically significant and had a large effect size, F(2, 27) = 5.02, p = .01, η² = 0.27. Tukey’s post hoc test indicated that audiobook and music groups experienced less pain than the control group."
Summary Table: Key ANOVA Concepts
Concept | Explanation |
|---|---|
Factor | Independent variable (e.g., generation) |
Level | Categories within the factor (e.g., Gen Z, Millennials) |
Between-Group Variance | Variance due to differences between group means |
Within-Group Variance | Variance within each group |
F Ratio | Ratio of between-group to within-group variance |
Eta Squared (η²) | Proportion of variance explained by the factor |
Cohen’s d | Effect size for pairwise group comparisons |
Additional info: These notes provide a comprehensive overview of one-way ANOVA, including its assumptions, calculations, interpretation, and reporting standards. The examples and tables are adapted for clarity and academic completeness.
