 Back
Analysis of Variance (ANOVA): Concepts, Assumptions, and Applications
Study Guide - Smart Notes
 Tailored notes based on your materials, expanded with key definitions, examples, and context.
Analysis of Variance (ANOVA)
Introduction to ANOVA
Analysis of Variance (ANOVA) is a statistical method used to compare means across two or more groups or conditions. It is particularly useful when examining the effect of one or more independent variables (factors) on a dependent variable. ANOVA helps control the family-wise error rate that arises when conducting multiple t-tests.
Key Point 1: ANOVA is used instead of multiple t-tests to avoid inflating the probability of Type I errors (false positives).
Key Point 2: ANOVA partitions the total variance in the data into variance explained by the model (experimental manipulation) and variance due to random error.
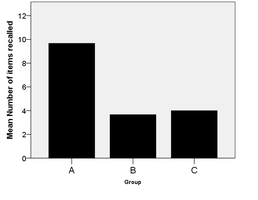
Example: Comparing the mean number of words recalled by three different groups (A, B, C).
Why Use ANOVA?
Controlling Type I Error
When comparing more than two groups, using multiple t-tests increases the risk of making at least one Type I error. ANOVA addresses this by testing all group means simultaneously, maintaining the overall significance level.
Family-wise Error Rate: The probability of making at least one Type I error across multiple comparisons increases with the number of tests.
Formula: where is the number of comparisons.
Example: For three comparisons at , the family-wise error rate is approximately 14%.
Fundamental Concepts in ANOVA
Single Factor and Factorial Designs
ANOVA can be applied to single factor (one independent variable) or factorial designs (two or more independent variables). Each factor can have multiple levels.
Single Factor Example: Age group (young, middle-aged, older adults).
Factorial Example: Age group and socio-economic status.
Theory of ANOVA: Partitioning Variance
ANOVA separates the total variance in the data into two components: variance due to the independent variable (signal) and variance due to random error (noise).
F Ratio:
Interpretation: A large F ratio suggests that the independent variable explains a significant portion of the variance.
Example Calculation: If experimental variance = 10 and random variance = 1, (likely significant).
Calculating the F-Ratio
Sum of Squares and Mean Squares
The F-ratio is calculated using sums of squares (SS) and mean squares (MS):
Total Sum of Squares (SStotal): Measures total variability in the dataset.
Model Sum of Squares (SSmodel): Variability explained by the independent variable.
Error Sum of Squares (SSerror): Variability not explained by the model.
Mean Squares: , where is degrees of freedom.
F-Ratio:
One-Way Independent (Between-Person) ANOVA
Application and Example
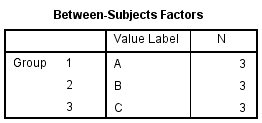
One-way independent ANOVA tests whether the means of three or more independent groups are significantly different.
Dependent Variable (DV): Number of words recalled
Independent Variable (IV): Group (A, B, C)
SPSS Output Interpretation
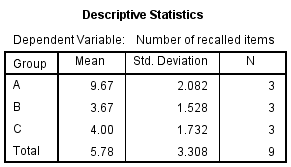
Descriptive Statistics: Shows means and standard deviations for each group.
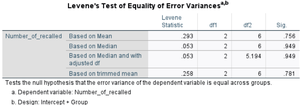
Levene’s Test: Tests homogeneity of variance assumption.
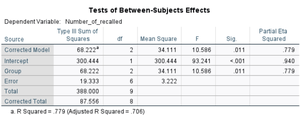
Tests of Between-Subjects Effects: Provides F-ratio, significance, and effect size.
Assumptions of ANOVA
Key Assumptions
Measurement Level: DV should be interval or ratio scale.
Independence: Observations must be independent (for between-person design).
Normality: Data should be approximately normally distributed.
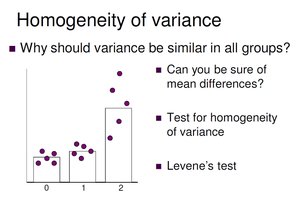
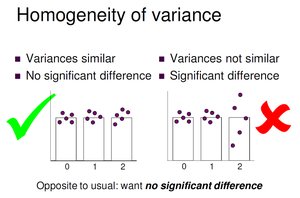
Homogeneity of Variance: Variance within each group should be similar.
Testing Homogeneity of Variance
Levene’s test is commonly used to assess whether group variances are equal. A non-significant result indicates that the assumption is met.
Planned and Post-Hoc Comparisons
Planned Comparisons
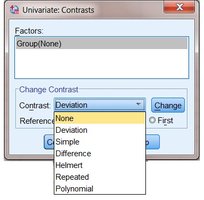
Planned comparisons (contrasts) are specified before data analysis and test specific hypotheses about group differences.
Types of Contrasts: Deviation, Simple, Difference, Helmert, Repeated, Polynomial
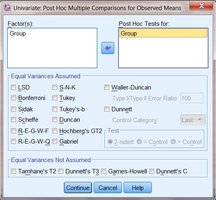
Post-Hoc Comparisons
Post-hoc tests are conducted after finding a significant ANOVA result to determine which groups differ. Common corrections for multiple comparisons include Bonferroni and Tukey’s HSD.
Bonferroni Correction: Adjusts significance level by dividing alpha by the number of comparisons.
Games-Howell: Used when variances are not equal.
One-Way Repeated Measures (Within-Person) ANOVA
Advantages and Assumptions
Repeated measures ANOVA is used when the same participants are measured under different conditions. This design controls for individual differences, increasing statistical power. However, it introduces the assumption of sphericity.
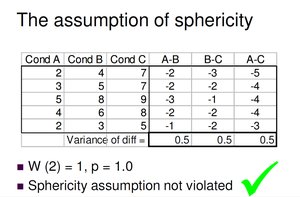
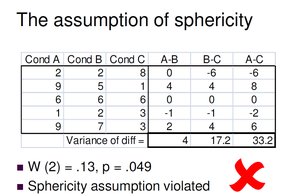
Sphericity: The variances of the differences between all combinations of related groups should be similar.
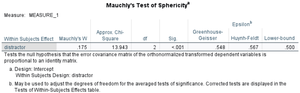
Mauchly’s Test: Assesses the sphericity assumption. A non-significant result means sphericity is not violated.
Corrections for Sphericity Violations
Greenhouse-Geisser Correction: Used when epsilon () < 0.75 (more conservative).
Huynh-Feldt Correction: Used when epsilon () > 0.75 (less conservative).
SPSS Output for Repeated Measures ANOVA
Descriptive Statistics: Means and standard deviations for each condition.
Mauchly’s Test: Indicates whether sphericity is met.
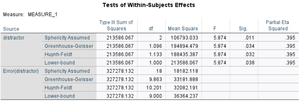
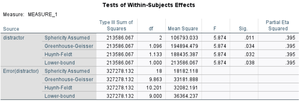
Tests of Within-Subjects Effects: Provides F-ratios and significance for each correction method.
Post-Hoc Tests for Repeated Measures
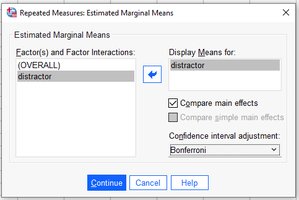
Post-hoc tests (e.g., Bonferroni) are used to compare all pairs of conditions when the main effect is significant.
Summary Table: Key ANOVA Concepts
Concept | Definition | Test/Correction |
|---|---|---|
Homogeneity of Variance | Variance is similar across groups | Levene's Test |
Sphericity | Variance of differences between conditions is similar | Mauchly's Test, Greenhouse-Geisser, Huynh-Feldt |
Planned Comparisons | Specific hypotheses tested before analysis | Contrasts (Simple, Polynomial, etc.) |
Post-Hoc Comparisons | All pairs compared after significant ANOVA | Bonferroni, Tukey, Games-Howell |
Conclusion
ANOVA is a powerful tool for comparing means across multiple groups or conditions. Understanding its assumptions, calculation, and interpretation is essential for valid statistical inference in research. Both independent and repeated measures ANOVA have specific requirements and post-analysis procedures to ensure robust results.
