 Back
BackAP Statistics 2nd Semester TEKS Test Review: Comprehensive Study Notes
Study Guide - Smart Notes
 Tailored notes based on your materials, expanded with key definitions, examples, and context.
Probability Distributions and Random Variables
Linear Transformations of Random Variables
When working with random variables, it is important to understand how their means and standard deviations change under linear transformations and combinations.
Linear Transformation: If is a random variable with mean and standard deviation , and and are constants, then for :
Mean:
Standard deviation:
Sum and Difference of Independent Random Variables: If and are independent:
Mean of :
Standard deviation:
Example: If has mean 75 and SD 12, has mean 14 and SD 5, then:
: Mean = 45, SD = 12
: Mean = 28, SD = 10
: Mean = 89, SD = 13
: Mean = 61, SD = 13
Discrete Probability Distributions
Expected Value, Variance, and Standard Deviation
The expected value (mean) of a discrete random variable with possible values and probabilities is:
The variance is:
The standard deviation is:
Example: For a probability distribution of glass flame temperatures or number of toys played with, use the above formulas to compute mean, variance, and standard deviation.
Binomial and Geometric Distributions
Binomial Distribution
A binomial random variable counts the number of successes in independent trials, each with probability of success.
Probability of exactly successes:
Mean:
Standard deviation:
Geometric Distribution
The geometric distribution models the number of trials until the first success.
Probability that the first success occurs on the th trial:
Normal Distribution and Sampling Distributions
Properties of the Normal Distribution
A normal distribution is symmetric, bell-shaped, and described by its mean and standard deviation .
Standardizing:
Probabilities can be found using standard normal tables or technology.
Sampling Distribution of the Sample Mean
If is normal with mean and SD , the sample mean of an SRS of size has mean $\mu$ and SD .
Central Limit Theorem: For large , the sampling distribution of is approximately normal, regardless of the population distribution.
Confidence Intervals and Hypothesis Testing
Confidence Intervals for Proportions and Means
For a proportion from a sample of size :
For a mean from a sample of size with sample SD :
Confidence interval for a mean:
Confidence interval for a proportion:
Hypothesis Testing
State hypotheses: (null), (alternative)
Calculate test statistic (z or t)
Find p-value and compare to significance level
Draw a conclusion: reject or fail to reject
Chi-Square Tests
Goodness-of-Fit, Independence, and Homogeneity
Goodness-of-fit: Tests if observed frequencies match expected frequencies for a single categorical variable.
Test of independence: Tests if two categorical variables are independent in a population.
Test of homogeneity: Tests if the distribution of a categorical variable is the same in several populations.
Test statistic:
Regression and Correlation
Least Squares Regression
Regression line:
Slope , where is the correlation coefficient
Standard error of the slope:
Correlation
Measures the strength and direction of a linear relationship between two quantitative variables.
Correlation coefficient ranges from -1 to 1.
Residuals in Regression Analysis
Definition and Interpretation of Residuals
In regression analysis, a residual is the difference between an observed value and the value predicted by the regression model. Residuals are used to assess the fit of the model and to check for patterns that might indicate non-linearity or other issues.
For each data point, the residual is calculated as:
Interpretation:
Positive residual: The observed value is above the predicted value.
Negative residual: The observed value is below the predicted value.
Sum of residuals in least squares regression is always zero (up to rounding error).
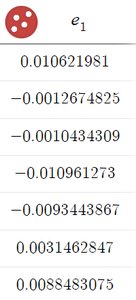
Example: The table above shows a set of residuals from a regression analysis. These values can be used to check for randomness (no pattern) and to verify that the sum is approximately zero, confirming a good fit for a linear model.
Inference Procedures, Power, and Errors
Type I and Type II Errors
Type I error (\(\alpha\)): Rejecting when it is true.
Type II error (\(\beta\)): Failing to reject when is true.
Power: Probability of correctly rejecting when is true.
Making Confidence Intervals Wider
Decrease sample size
Increase confidence level
Increase standard deviation
Formulas for Standard Errors
Standard error about the least squares line:
Standard error for a 2-sample proportion:
Standard error of the sample mean:
Standard error of the proportion:
Choosing the Correct Inference Procedure
Different statistical questions require different inference procedures, such as t-tests, z-tests, chi-square tests, and regression analysis. Always check the assumptions and conditions before applying a procedure.
Additional info: These notes are structured to cover the main topics in a college-level statistics course, including probability, distributions, inference, regression, and categorical data analysis. The included image is a table of residuals, directly relevant to regression diagnostics.
