 Back
BackApplications of the Normal Distribution
Study Guide - Smart Notes
 Tailored notes based on your materials, expanded with key definitions, examples, and context.
Applications of Normal Distributions
Mean and Standard Deviation
The normal distribution is a continuous probability distribution characterized by its bell-shaped curve, defined by the mean () and standard deviation (). The mean determines the center of the distribution, while the standard deviation measures the spread or dispersion of the data.
Mean (): The average value of the distribution.
Standard Deviation (): Indicates how much the values deviate from the mean.
The probability of a value falling within a certain range can be found by calculating the area under the curve between those values.
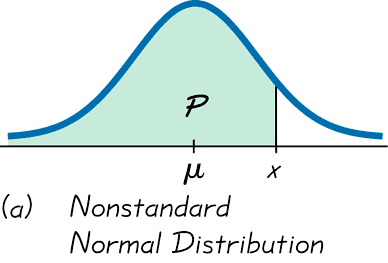
Converting to a Standard Normal Distribution
To simplify calculations, values from any normal distribution can be converted to the standard normal distribution, which has a mean of 0 and a standard deviation of 1. This process is called standardization and uses the z-score formula:
Z-score: The number of standard deviations a value is from the mean.
The formula for converting to is:
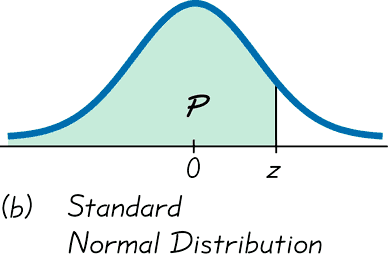
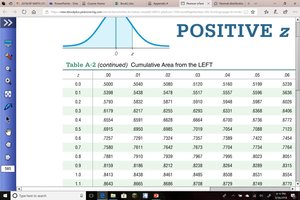
Once converted, probabilities can be found using the standard normal table or technology.
Finding Probabilities and Percentiles
Probabilities for normal distributions are found by calculating the area under the curve. For example, to find the probability that a value falls between two points, calculate the area between those points.
Example: Women’s heights are normally distributed with a mean of 63.8 in. and a standard deviation of 2.6 in. The U.S. Navy requires fighter pilots to have heights between 62 in. and 78 in. To find the percentage of women who meet this requirement, convert the heights to z-scores and use the standard normal table or technology to find the area between them.
Calculation: ,
Find the area between and using the standard normal table.
Result: Approximately 75.48% of women meet the height requirement.
Inverse Normal Calculations (Percentiles)
To find the value corresponding to a given percentile (e.g., the 80th percentile), use the inverse normal function. This function finds the value such that a specified proportion of the distribution lies to the left of $x$.
Example: For women’s heights (mean 63.8 in., standard deviation 2.6 in.), the 80th percentile corresponds to a z-score of approximately 0.85. The value is found by:
So,
Using Technology for Normal Distribution Calculations
Modern calculators and software can compute probabilities and percentiles for normal distributions directly, without converting to z-scores:
To find the area to the left of : =NORM.DIST(x, mean, std dev, TRUE)
To find the value for a given area to the left: =NORM.INV(probability, mean, std dev)
Statistical software (e.g., Statcrunch) allows for custom mean and standard deviation.
Technology is generally more accurate than using printed tables.
Additional Examples
Example: The weight of a “12-ounce” bag of potato chips is normally distributed with a mean of 12 ounces and a standard deviation of 0.56 ounces.
Probability of 13 or more ounces: Convert 13 to a z-score and find the area to the right using the standard normal table or technology.
First quartile: The first quartile corresponds to the 25th percentile. Use the inverse normal function to find the value of such that 25% of the distribution is to the left.
Summary Table: Key Normal Distribution Functions
Function | Purpose | Excel Command |
|---|---|---|
Find area to left of x | Probability | =NORM.DIST(x, mean, std dev, TRUE) |
Find value for given area | Percentile value | =NORM.INV(probability, mean, std dev) |
