 Back
Applications of the Normal Distribution in Statistics
Study Guide - Smart Notes
 Tailored notes based on your materials, expanded with key definitions, examples, and context.
Normal Distribution and Continuous Random Variables
Applications of the Normal Distribution
The normal distribution is a fundamental concept in statistics, used to model many real-world phenomena. It is characterized by its bell-shaped curve, defined by the mean (\( \mu \)) and standard deviation (\( \sigma \)). In this section, we explore practical applications of the normal distribution, including calculating probabilities and finding specific values using statistical tools.
Finding the Probability for a Value in a Normal Distribution
To determine the probability that a randomly selected value from a normal distribution falls below a certain threshold, we use the cumulative distribution function (CDF). This can be calculated using statistical tables or graphing calculators.
Key Point 1: The probability that a value is less than a given number is represented by the area under the curve to the left of that number.
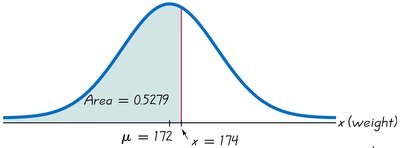
Key Point 2: For a normal distribution with mean \( \mu = 172 \) pounds and standard deviation \( \sigma = 29 \) pounds, the probability that a randomly selected man weighs less than 174 pounds can be found using the calculator function normalcdf.
Formula: For this example:
Example: The area under the curve to the left of 174 pounds is approximately 0.5275, meaning about 52.75% of men weigh less than 174 pounds.
Finding a Value Corresponding to a Given Percentile
Sometimes, we want to find the value that separates a certain percentage of the population from the rest. This is known as finding a percentile or a cutoff value. The invNorm function on calculators is used for this purpose.
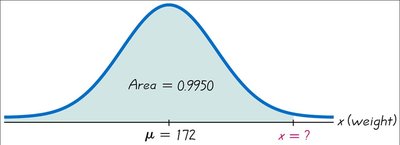
Key Point 1: The value that separates the lightest 99.5% of men from the heaviest 0.5% is the 99.5th percentile.
Key Point 2: For a normal distribution with mean \( \mu = 172 \) pounds and standard deviation \( \sigma = 29 \) pounds, use invNorm to find the cutoff value.
Formula: For this example:
Example: The weight that separates the lightest 99.5% of men from the heaviest 0.5% is approximately 247 pounds.
Calculator Functions for Normal Distribution
Modern graphing calculators, such as the TI-83/84 Plus, provide built-in functions for normal distribution calculations:
normalcdf: Computes the probability that a value falls within a specified range.
invNorm: Finds the value corresponding to a specified cumulative probability.
Note: Results from calculators may differ slightly from those obtained using traditional z-tables due to rounding and calculation methods.
Summary Table: Calculator Functions for Normal Distribution
Function | Purpose | Example Input | Example Output |
|---|---|---|---|
normalcdf | Find probability for a range | normalcdf(-1099, 174, 172, 29) | 0.5275 |
invNorm | Find value for a given percentile | invNorm(0.995, 172, 29) | 247 |
Additional info: The normal distribution is widely used in inferential statistics, quality control, and many scientific fields. Understanding how to use calculator functions and interpret areas under the curve is essential for statistical analysis.
