 Back
BackLesson 5
Study Guide - Smart Notes
 Tailored notes based on your materials, expanded with key definitions, examples, and context.
Chapter 3: Association – Contingency, Correlation, and Regression
Section 3.1: Exploring the Association between Two Categorical Variables
Understanding the relationship between two categorical variables is fundamental in statistics. This section introduces key concepts and tools for analyzing such associations.
Response and Explanatory Variables
Response Variable (Dependent Variable): The outcome variable on which comparisons are made.
Explanatory Variable (Independent Variable): Defines the groups to be compared with respect to values on the response variable.
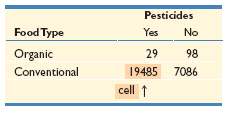
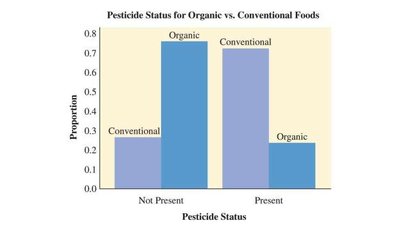
Example: In a study of food types and pesticide presence, pesticide status is the response variable, and food type (organic or conventional) is the explanatory variable.
Definition of Association
An association exists between two variables if a particular value for one variable is more likely to occur with certain values of the other variable.
The main purpose of data analysis with two variables is to investigate and describe such associations.
Contingency Tables
A contingency table displays the frequency distribution of variables and is a primary tool for summarizing the association between two categorical variables.
Rows represent categories of one variable; columns represent categories of the other.
Each cell shows the frequency (count) for a specific combination of categories.
Calculating Proportions and Conditional Proportions
Proportions and conditional proportions help quantify associations in contingency tables.
Proportion: The fraction of the total that falls into a specific cell or category.
Conditional Proportion: The proportion of cases in one category of the explanatory variable that fall into a specific category of the response variable.
For example, the proportion of organic foods containing pesticides is calculated as .
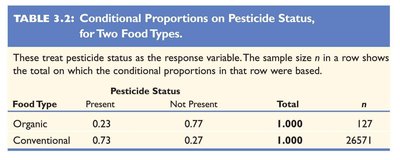
Interpreting Conditional Proportions
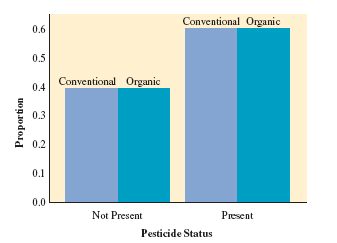
If there is no association between the variables, the conditional proportions for the response variable categories will be the same for each group of the explanatory variable.
Differences in conditional proportions indicate an association.
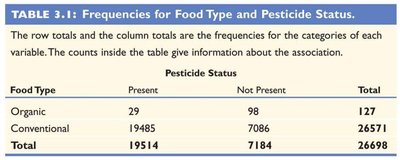
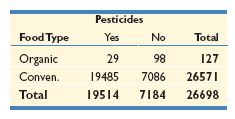
Summary Table: Frequencies for Food Type and Pesticide Status
Food Type | Present | Not Present | Total |
|---|---|---|---|
Organic | 29 | 98 | 127 |
Conventional | 19485 | 7086 | 26571 |
Total | 19514 | 7184 | 26698 |
Summary Table: Conditional Proportions on Pesticide Status
Food Type | Present | Not Present | Total | n |
|---|---|---|---|---|
Organic | 0.23 | 0.77 | 1.000 | 127 |
Conventional | 0.73 | 0.27 | 1.000 | 26571 |
Section 3.2: Exploring the Association between Two Quantitative Variables
When both variables are quantitative, scatterplots and correlation coefficients are used to analyze their association.
Scatterplots
A scatterplot is a graphical display of the relationship between two quantitative variables.
The x-axis represents the explanatory variable, and the y-axis represents the response variable.
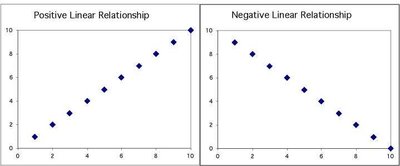
Scatterplots reveal the form, direction, and strength of the association.
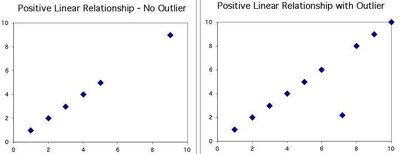
Interpreting Scatterplots
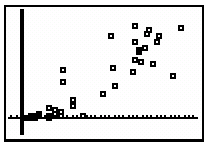
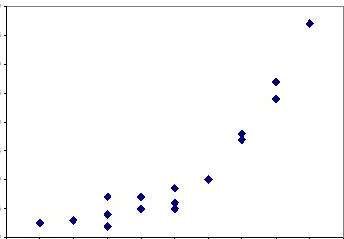
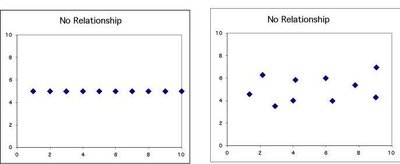
Form: Linear, curved, clusters, or no pattern.
Direction: Positive (as x increases, y increases), negative (as x increases, y decreases), or no direction.
Strength: How closely the points fit the trend.
Outliers: Points that deviate markedly from the overall pattern.
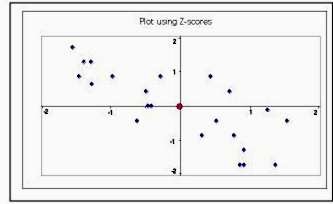
Correlation Coefficient (r)
The correlation coefficient measures the strength and direction of the linear association between two quantitative variables.
Properties of r:
Always between -1 and +1.
Sign indicates direction: positive or negative.
Unitless measure; unaffected by changes in units.
Symmetric: does not distinguish between explanatory and response variables.
Not resistant to outliers.
Only measures linear relationships.
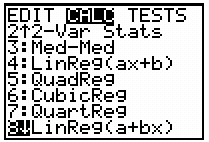
Formula for r:
Examples and Applications
Correlation between batting average and team scoring in baseball.
Correlation between time to swim and pulse rate in athletes.
Effect of Outliers
Outliers can have a significant impact on the value of r, often reducing the strength of the observed association.
It is important to identify and evaluate outliers when interpreting correlation and regression results.
Lesson Summary
The value of the response variable depends on the explanatory variable.
For two categorical variables, use contingency tables and conditional proportions to summarize associations.
For two quantitative variables, use scatterplots and the correlation coefficient to describe the strength and direction of linear associations.
Outliers must be identified and considered due to their influence on correlation and regression.
