 Back
BackBasic Concepts and Methods in Statistics: Week 1 Study Guide
Study Guide - Smart Notes
 Tailored notes based on your materials, expanded with key definitions, examples, and context.
Basic Concepts of Statistics
What is Statistics?
Statistics is the science concerned with developing and studying methods for collecting, analyzing, interpreting, and presenting empirical data. The "information" that is collected, organized, and analyzed in statistics is referred to as data.
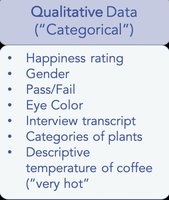
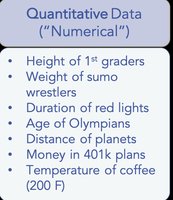
Data can be numerical (quantitative) or non-numerical (qualitative).
Statistics helps us make sense of data and draw conclusions about populations based on samples.
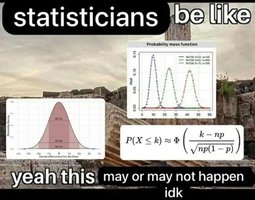
Statistical Significance vs Practical Significance
Statistical significance refers to the likelihood that a result or relationship is caused by something other than random chance. Practical significance considers whether the result is large enough to be meaningful in the real world.
Statistical significance is often determined by p-values and hypothesis testing.
Practical significance asks whether the effect size is large enough to matter.
Beware of "p-hacking" or manipulating data to find significance.
Summary statistics (like averages) can be misleading without context.
Examples of Statistical Statements
NFL Salary stats: Outliers and averages can highlight disparities.
Health statistics: Descriptive statistics summarize large populations, such as average salaries or educational attainment among nurses.
Statistical and Critical Thinking
The Who, What, Why, and How
Critical thinking in statistics involves understanding the context of data collection, the population under study, and the methods used to analyze data.
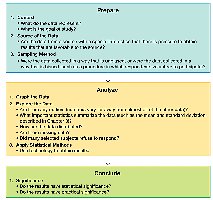
What Makes a Good Statistical Question?
A good statistical question is clear, focused, and can be answered with data. It should address variability and be relevant to the population of interest.

Key Statistical Terms
Population, Sample, and Individual
The population is the entire group under study. An individual is a member of the population. A sample is a subset of the population.
Census: Collecting data from every member of the population.
Sample: Collecting data from a subset of the population.
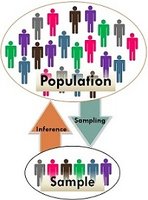
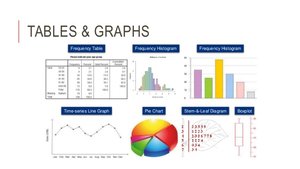
Descriptive vs Inferential Statistics
Descriptive statistics involves organizing, summarizing, and presenting data. Inferential statistics uses methods to make generalizations from a sample to a population and measure reliability.
Descriptive: Tables, graphs, numerical summaries.
Inferential: Estimation, hypothesis testing.
Statistic vs Parameter
A statistic is a numerical summary of a sample. A parameter is a numerical summary of a population.
Example: Average weekly spending from a sample is a statistic; from the entire population, it is a parameter.
Variables in Statistics
Variables are characteristics of individuals within the population. They can be classified as qualitative or quantitative.
Qualitative variables: Descriptive, often non-numerical.
Quantitative variables: Numerical, can be manipulated mathematically.
Levels of Measurement
Nominal, Ordinal, Interval, Ratio
Variables can be classified by their level of measurement:
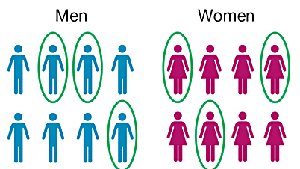
Nominal: Categories only, no order (e.g., car model).
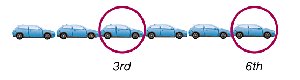
Ordinal: Categories with order (e.g., language ability: beginner, intermediate, fluent).
Interval: Ordered, differences have meaning, no true zero (e.g., temperature in Celsius).
Ratio: Ordered, differences and ratios have meaning, true zero (e.g., height).
Discrete vs Continuous Variables
Discrete variables have a finite or countable number of values. Continuous variables have an infinite number of possible values within a range.
Discrete: Number of students in a class.
Continuous: Height, weight, spending.
Collecting Data: Methods and Designs
Observational Studies vs Experiments
Data can be collected through observational studies (no intervention) or experiments (apply treatment and observe effects).
Observational study: Observe and measure characteristics without modifying subjects.
Experiment: Apply treatment and observe effects.
Confounding and Lurking Variables
Confounding occurs when it is unclear which factor caused an observed effect. Lurking variables are hidden variables that influence the outcome.
Design of Experiments
Replication: Repeating experiments on multiple subjects.
Blinding: Subjects do not know if they receive treatment or placebo.
Double-blind: Both subjects and experimenters are unaware of treatment assignment.
Randomization: Assign subjects to groups by chance.
Sampling Methods
Simple Random Sample
Every possible sample of size n has the same chance of being chosen.
Systematic Sampling
Select a starting point and then every kth element in the population.
Convenience Sampling
Use data that are easy to obtain, often leading to bias.

Stratified Sampling
Divide the population into subgroups (strata) and sample from each subgroup.
Cluster Sampling
Divide the population into clusters, randomly select clusters, and sample all members within selected clusters.
Multistage Sampling
Combine several sampling methods in stages.
Types of Observational Studies
Cross-sectional study: Data collected at one point in time.
Retrospective (case-control) study: Data collected from past records.
Prospective (cohort) study: Data collected in the future from groups sharing common factors.
Controlling Effects of Variables
Completely Randomized Design: Subjects assigned to groups randomly.
Randomized Block Design: Subjects grouped by similar characteristics, then randomly assigned treatments within blocks.
Matched Pairs Design: Subjects matched in pairs based on similarity, then assigned to different treatments.
Rigorously Controlled Design: Subjects carefully assigned to ensure similarity across treatment groups.
Sampling Errors and Bias
Sampling Error
Occurs due to random sample fluctuations; difference between sample result and true population result.
Nonsampling Error
Results from human error, biased questions, incorrect data entry, or inappropriate statistical methods.
Nonrandom Sampling Error
Occurs when nonrandom methods (e.g., convenience sampling) are used.
Sources of Bias in Sampling
Undercoverage: Some population members are inadequately represented.
Non-response: Selected individuals do not respond.
Response bias: Respondents provide inaccurate answers.
Voluntary response bias: Only those with strong opinions respond.

Summary Table: Levels of Measurement
Level | Description | Example |
|---|---|---|
Nominal | Categories only | Car model |
Ordinal | Categories with order | Language ability |
Interval | Differences, no true zero | Temperature (Celsius) |
Ratio | Differences and true zero | Height |
Review Questions
What is the difference between a population and a sample?
What are the characteristics of a good statistical question?
What is the difference between categorical and quantitative variables?
What is an observational unit?
What is the difference between a parameter and a statistic?
Describe how each sampling method could be used to pull a random sample of 5 students from class.
