 Back
BackBinomial Probability Distributions: Concepts, Notation, and Applications
Study Guide - Smart Notes
 Tailored notes based on your materials, expanded with key definitions, examples, and context.
Binomial Probability Distributions
Definition and Requirements
A binomial probability distribution describes the probability of obtaining a fixed number of successes in a fixed number of independent trials, where each trial has only two possible outcomes. The following four requirements must be met for a probability distribution to be classified as binomial:
Fixed Number of Trials: The experiment consists of a set number of trials, denoted as n.
Independence: The outcome of any individual trial does not affect the outcomes of the other trials.
Two Categories: Each trial results in one of two outcomes, commonly labeled as "success" and "failure." Note that "success" is a technical term and does not necessarily imply something positive.
Constant Probability: The probability of success, denoted as p, remains the same for each trial.
Notation
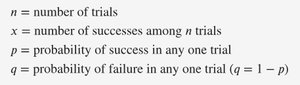
The following notation is commonly used in binomial probability problems:
n: Number of trials
x: Number of successes among n trials
p: Probability of success in any one trial
q: Probability of failure in any one trial (where q = 1 - p)
Binomial Probability Formula
The probability of obtaining exactly x successes in n independent binomial trials is given by the binomial probability formula:
n! denotes the factorial of n.
p is the probability of success on a single trial.
q is the probability of failure on a single trial.
This formula calculates the probability of observing exactly x successes in n trials.
Mean and Standard Deviation of a Binomial Distribution
The mean (expected value) and standard deviation of a binomial distribution are calculated as follows:
Mean:
Standard Deviation:
These formulas allow us to describe the center and spread of the binomial distribution.
Application Example: NFL Overtime Wins
Consider a scenario where we analyze the number of overtime wins in NFL football games. Suppose we have the following parameters:
n = 460 (number of overtime games)
p = 0.5 (probability of winning, assuming no advantage)
q = 0.5 (probability of losing)
To find the mean and standard deviation:
Mean:
Standard Deviation:
To determine if a result is significantly high or low, we use the range rule of thumb:
Significantly low: Values less than
Significantly high: Values greater than
For this example:
Therefore, a result of 252 overtime wins in 460 games would be considered significantly high, as it exceeds 251.45.
Summary Table: Binomial Distribution Parameters
Parameter | Symbol | Formula | Description |
|---|---|---|---|
Number of trials | n | — | Total number of independent experiments |
Number of successes | x | — | Number of successful outcomes observed |
Probability of success | p | — | Probability of success in a single trial |
Probability of failure | q | q = 1 - p | Probability of failure in a single trial |
Mean | \mu | \mu = np | Expected number of successes |
Standard deviation | \sigma | \sigma = \sqrt{npq} | Spread of the distribution |
